Market Participants Recognise Fenbi Ltd.'s (HKG:2469) Earnings Pushing Shares 26% Higher
The Fenbi Ltd. (HKG:2469) share price has done very well over the last month, posting an excellent gain of 26%. Unfortunately, the gains of the last month did little to right the losses of the last year with the stock still down 24% over that time.
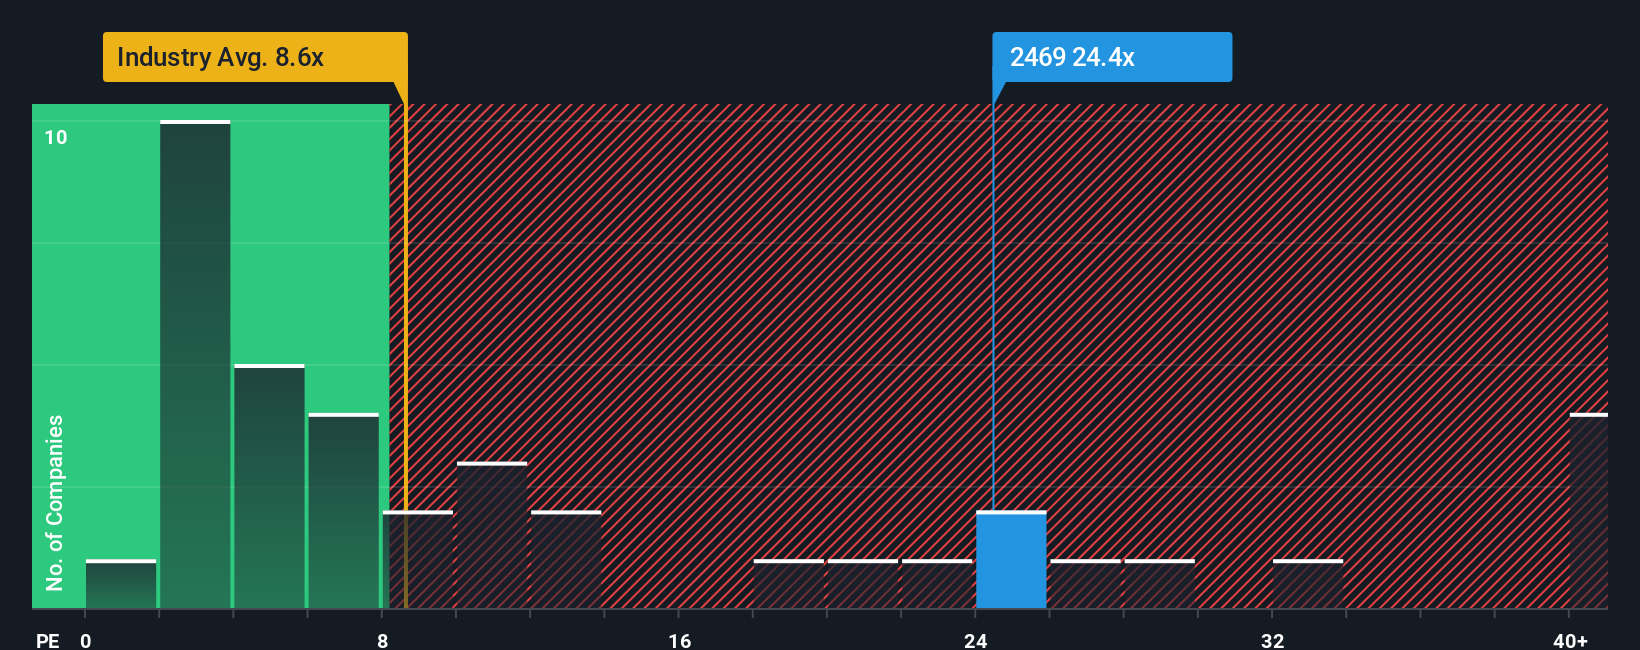
After such a large jump in price, given close to half the companies in Hong Kong have price-to-earnings ratios (or "P/E's") below 11x, you may consider Fenbi as a stock to avoid entirely with its 24.4x P/E ratio. Nonetheless, we'd need to dig a little deeper to determine if there is a rational basis for the highly elevated P/E.
We've found 21 US stocks that are forecast to pay a dividend yield of over 6% next year. See the full list for free.
With earnings growth that's superior to most other companies of late, Fenbi has been doing relatively well. The P/E is probably high because investors think this strong earnings performance will continue. If not, then existing shareholders might be a little nervous about the viability of the share price.
See our latest analysis for Fenbi
What Are Growth Metrics Telling Us About The High P/E?
Fenbi's P/E ratio would be typical for a company that's expected to deliver very strong growth, and importantly, perform much better than the market.
If we review the last year of earnings growth, the company posted a terrific increase of 28%. However, the latest three year period hasn't been as great in aggregate as it didn't manage to provide any growth at all. Therefore, it's fair to say that earnings growth has been inconsistent recently for the company.
Turning to the outlook, the next three years should generate growth of 17% per annum as estimated by the four analysts watching the company. Meanwhile, the rest of the market is forecast to only expand by 15% per year, which is noticeably less attractive.
In light of this, it's understandable that Fenbi's P/E sits above the majority of other companies. Apparently shareholders aren't keen to offload something that is potentially eyeing a more prosperous future.
The Final Word
The strong share price surge has got Fenbi's P/E rushing to great heights as well. While the price-to-earnings ratio shouldn't be the defining factor in whether you buy a stock or not, it's quite a capable barometer of earnings expectations.
As we suspected, our examination of Fenbi's analyst forecasts revealed that its superior earnings outlook is contributing to its high P/E. Right now shareholders are comfortable with the P/E as they are quite confident future earnings aren't under threat. Unless these conditions change, they will continue to provide strong support to the share price.
The company's balance sheet is another key area for risk analysis. You can assess many of the main risks through our free balance sheet analysis for Fenbi with six simple checks.
If P/E ratios interest you, you may wish to see this free collection of other companies with strong earnings growth and low P/E ratios.
New: AI Stock Screener & Alerts
Our new AI Stock Screener scans the market every day to uncover opportunities.
• Dividend Powerhouses (3%+ Yield)• Undervalued Small Caps with Insider Buying• High growth Tech and AI CompaniesOr build your own from over 50 metrics.
Explore Now for FreeHave feedback on this article? Concerned about the content? Get in touch with us directly. Alternatively, email editorial-team (at) simplywallst.com.This article by Simply Wall St is general in nature. We provide commentary based on historical data and analyst forecasts only using an unbiased methodology and our articles are not intended to be financial advice. It does not constitute a recommendation to buy or sell any stock, and does not take account of your objectives, or your financial situation. We aim to bring you long-term focused analysis driven by fundamental data. Note that our analysis may not factor in the latest price-sensitive company announcements or qualitative material. Simply Wall St has no position in any stocks mentioned.
Disclaimer: Investing carries risk. This is not financial advice. The above content should not be regarded as an offer, recommendation, or solicitation on acquiring or disposing of any financial products, any associated discussions, comments, or posts by author or other users should not be considered as such either. It is solely for general information purpose only, which does not consider your own investment objectives, financial situations or needs. TTM assumes no responsibility or warranty for the accuracy and completeness of the information, investors should do their own research and may seek professional advice before investing.
Most Discussed
- 1
- 2
- 3
- 4
- 5
- 6
- 7
- 8
- 9
- 10