China Oriental Group Company Limited's (HKG:581) Share Price Boosted 28% But Its Business Prospects Need A Lift Too
China Oriental Group Company Limited (HKG:581) shares have continued their recent momentum with a 28% gain in the last month alone. The last 30 days bring the annual gain to a very sharp 46%.
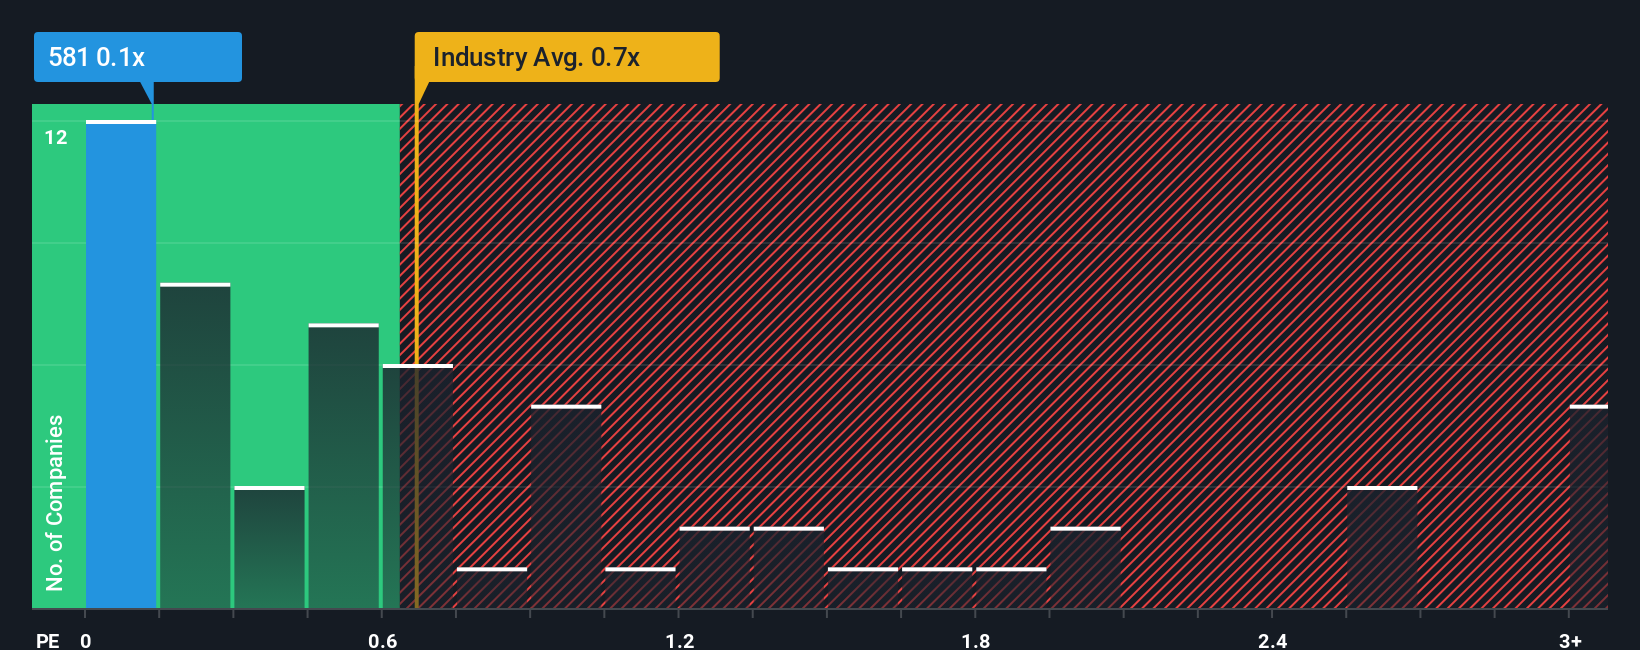
Even after such a large jump in price, given about half the companies operating in Hong Kong's Metals and Mining industry have price-to-sales ratios (or "P/S") above 0.7x, you may still consider China Oriental Group as an attractive investment with its 0.1x P/S ratio. Although, it's not wise to just take the P/S at face value as there may be an explanation why it's limited.
Trump has pledged to "unleash" American oil and gas and these 15 US stocks have developments that are poised to benefit.
Check out our latest analysis for China Oriental Group
What Does China Oriental Group's Recent Performance Look Like?
As an illustration, revenue has deteriorated at China Oriental Group over the last year, which is not ideal at all. Perhaps the market believes the recent revenue performance isn't good enough to keep up the industry, causing the P/S ratio to suffer. If you like the company, you'd be hoping this isn't the case so that you could potentially pick up some stock while it's out of favour.
Although there are no analyst estimates available for China Oriental Group, take a look at this free data-rich visualisation to see how the company stacks up on earnings, revenue and cash flow.What Are Revenue Growth Metrics Telling Us About The Low P/S?
In order to justify its P/S ratio, China Oriental Group would need to produce sluggish growth that's trailing the industry.
Taking a look back first, the company's revenue growth last year wasn't something to get excited about as it posted a disappointing decline of 7.1%. This means it has also seen a slide in revenue over the longer-term as revenue is down 17% in total over the last three years. Accordingly, shareholders would have felt downbeat about the medium-term rates of revenue growth.
In contrast to the company, the rest of the industry is expected to grow by 11% over the next year, which really puts the company's recent medium-term revenue decline into perspective.
With this information, we are not surprised that China Oriental Group is trading at a P/S lower than the industry. However, we think shrinking revenues are unlikely to lead to a stable P/S over the longer term, which could set up shareholders for future disappointment. Even just maintaining these prices could be difficult to achieve as recent revenue trends are already weighing down the shares.
The Bottom Line On China Oriental Group's P/S
The latest share price surge wasn't enough to lift China Oriental Group's P/S close to the industry median. Typically, we'd caution against reading too much into price-to-sales ratios when settling on investment decisions, though it can reveal plenty about what other market participants think about the company.
It's no surprise that China Oriental Group maintains its low P/S off the back of its sliding revenue over the medium-term. At this stage investors feel the potential for an improvement in revenue isn't great enough to justify a higher P/S ratio. Given the current circumstances, it seems unlikely that the share price will experience any significant movement in either direction in the near future if recent medium-term revenue trends persist.
Before you take the next step, you should know about the 3 warning signs for China Oriental Group (1 is a bit concerning!) that we have uncovered.
If these risks are making you reconsider your opinion on China Oriental Group, explore our interactive list of high quality stocks to get an idea of what else is out there.
New: AI Stock Screener & Alerts
Our new AI Stock Screener scans the market every day to uncover opportunities.
• Dividend Powerhouses (3%+ Yield)• Undervalued Small Caps with Insider Buying• High growth Tech and AI CompaniesOr build your own from over 50 metrics.
Explore Now for FreeHave feedback on this article? Concerned about the content? Get in touch with us directly. Alternatively, email editorial-team (at) simplywallst.com.This article by Simply Wall St is general in nature. We provide commentary based on historical data and analyst forecasts only using an unbiased methodology and our articles are not intended to be financial advice. It does not constitute a recommendation to buy or sell any stock, and does not take account of your objectives, or your financial situation. We aim to bring you long-term focused analysis driven by fundamental data. Note that our analysis may not factor in the latest price-sensitive company announcements or qualitative material. Simply Wall St has no position in any stocks mentioned.
Disclaimer: Investing carries risk. This is not financial advice. The above content should not be regarded as an offer, recommendation, or solicitation on acquiring or disposing of any financial products, any associated discussions, comments, or posts by author or other users should not be considered as such either. It is solely for general information purpose only, which does not consider your own investment objectives, financial situations or needs. TTM assumes no responsibility or warranty for the accuracy and completeness of the information, investors should do their own research and may seek professional advice before investing.
Most Discussed
- 1
- 2
- 3
- 4
- 5
- 6
- 7
- 8
- 9
- 10