Acadian Asset Management Inc. (NYSE:AAMI) Soars 26% But It's A Story Of Risk Vs Reward
Despite an already strong run, Acadian Asset Management Inc. (NYSE:AAMI) shares have been powering on, with a gain of 26% in the last thirty days. The last 30 days bring the annual gain to a very sharp 64%.
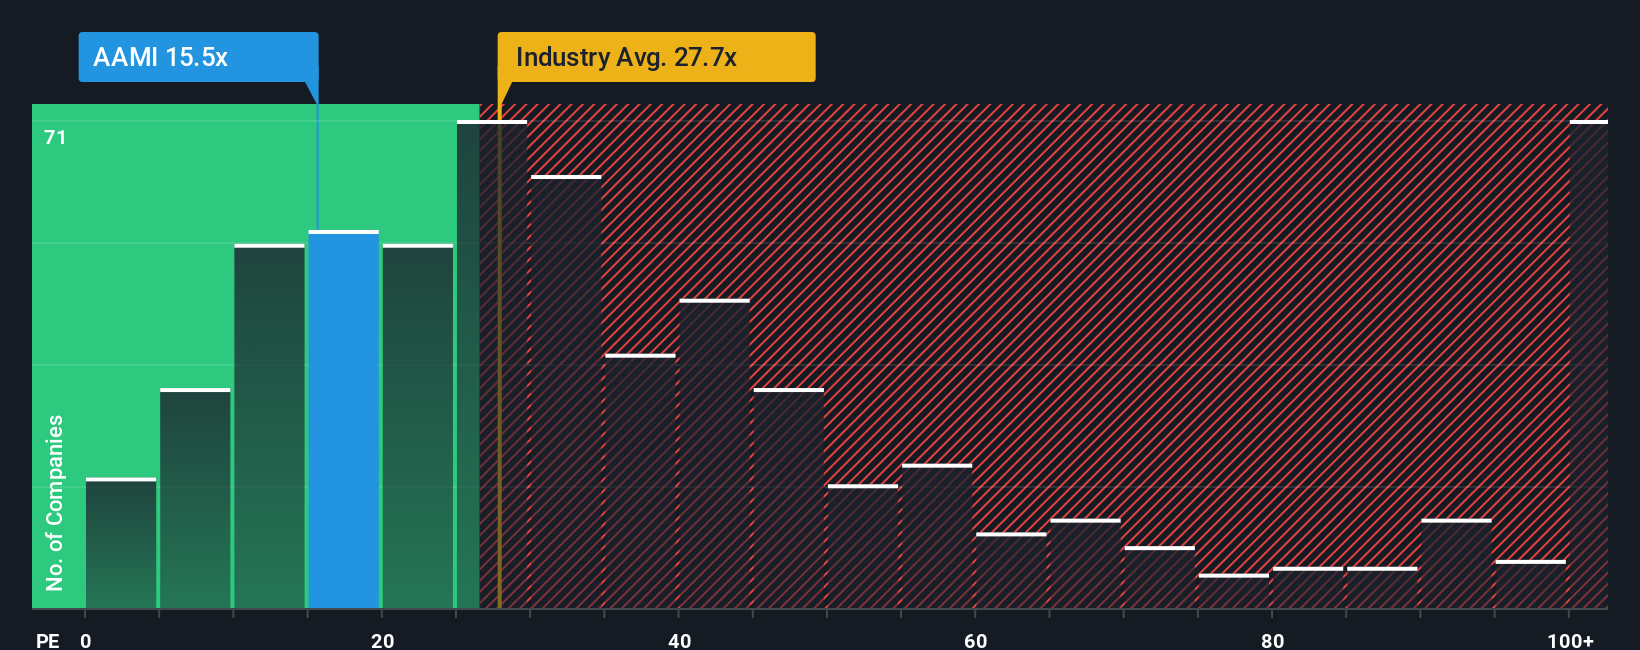
Although its price has surged higher, given about half the companies in the United States have price-to-earnings ratios (or "P/E's") above 19x, you may still consider Acadian Asset Management as an attractive investment with its 15.5x P/E ratio. Although, it's not wise to just take the P/E at face value as there may be an explanation why it's limited.
Trump has pledged to "unleash" American oil and gas and these 15 US stocks have developments that are poised to benefit.
Acadian Asset Management certainly has been doing a great job lately as it's been growing earnings at a really rapid pace. It might be that many expect the strong earnings performance to degrade substantially, which has repressed the P/E. If you like the company, you'd be hoping this isn't the case so that you could potentially pick up some stock while it's out of favour.
Check out our latest analysis for Acadian Asset Management
Does Growth Match The Low P/E?
There's an inherent assumption that a company should underperform the market for P/E ratios like Acadian Asset Management's to be considered reasonable.
Retrospectively, the last year delivered an exceptional 45% gain to the company's bottom line. The latest three year period has also seen an excellent 120% overall rise in EPS, aided by its short-term performance. Accordingly, shareholders would have probably welcomed those medium-term rates of earnings growth.
Comparing that to the market, which is only predicted to deliver 13% growth in the next 12 months, the company's momentum is stronger based on recent medium-term annualised earnings results.
With this information, we find it odd that Acadian Asset Management is trading at a P/E lower than the market. Apparently some shareholders believe the recent performance has exceeded its limits and have been accepting significantly lower selling prices.
What We Can Learn From Acadian Asset Management's P/E?
Despite Acadian Asset Management's shares building up a head of steam, its P/E still lags most other companies. Generally, our preference is to limit the use of the price-to-earnings ratio to establishing what the market thinks about the overall health of a company.
We've established that Acadian Asset Management currently trades on a much lower than expected P/E since its recent three-year growth is higher than the wider market forecast. There could be some major unobserved threats to earnings preventing the P/E ratio from matching this positive performance. At least price risks look to be very low if recent medium-term earnings trends continue, but investors seem to think future earnings could see a lot of volatility.
Before you take the next step, you should know about the 2 warning signs for Acadian Asset Management that we have uncovered.
Of course, you might also be able to find a better stock than Acadian Asset Management. So you may wish to see this free collection of other companies that have reasonable P/E ratios and have grown earnings strongly.
New: Manage All Your Stock Portfolios in One Place
We've created the ultimate portfolio companion for stock investors, and it's free.
• Connect an unlimited number of Portfolios and see your total in one currency• Be alerted to new Warning Signs or Risks via email or mobile• Track the Fair Value of your stocks
Try a Demo Portfolio for FreeHave feedback on this article? Concerned about the content? Get in touch with us directly. Alternatively, email editorial-team (at) simplywallst.com.This article by Simply Wall St is general in nature. We provide commentary based on historical data and analyst forecasts only using an unbiased methodology and our articles are not intended to be financial advice. It does not constitute a recommendation to buy or sell any stock, and does not take account of your objectives, or your financial situation. We aim to bring you long-term focused analysis driven by fundamental data. Note that our analysis may not factor in the latest price-sensitive company announcements or qualitative material. Simply Wall St has no position in any stocks mentioned.
Disclaimer: Investing carries risk. This is not financial advice. The above content should not be regarded as an offer, recommendation, or solicitation on acquiring or disposing of any financial products, any associated discussions, comments, or posts by author or other users should not be considered as such either. It is solely for general information purpose only, which does not consider your own investment objectives, financial situations or needs. TTM assumes no responsibility or warranty for the accuracy and completeness of the information, investors should do their own research and may seek professional advice before investing.
Most Discussed
- 1
- 2
- 3
- 4
- 5
- 6
- 7
- 8
- 9
- 10