Is XD Inc.'s (HKG:2400) Latest Stock Performance A Reflection Of Its Financial Health?
XD's (HKG:2400) stock is up by a considerable 58% over the past three months. Given the company's impressive performance, we decided to study its financial indicators more closely as a company's financial health over the long-term usually dictates market outcomes. Particularly, we will be paying attention to XD's ROE today.
Return on equity or ROE is an important factor to be considered by a shareholder because it tells them how effectively their capital is being reinvested. In simpler terms, it measures the profitability of a company in relation to shareholder's equity.
Trump has pledged to "unleash" American oil and gas and these 15 US stocks have developments that are poised to benefit.
How To Calculate Return On Equity?
ROE can be calculated by using the formula:
Return on Equity = Net Profit (from continuing operations) ÷ Shareholders' Equity
So, based on the above formula, the ROE for XD is:
33% = CN¥890m ÷ CN¥2.7b (Based on the trailing twelve months to December 2024).
The 'return' is the yearly profit. Another way to think of that is that for every HK$1 worth of equity, the company was able to earn HK$0.33 in profit.
See our latest analysis for XD
Why Is ROE Important For Earnings Growth?
Thus far, we have learned that ROE measures how efficiently a company is generating its profits. We now need to evaluate how much profit the company reinvests or "retains" for future growth which then gives us an idea about the growth potential of the company. Generally speaking, other things being equal, firms with a high return on equity and profit retention, have a higher growth rate than firms that don’t share these attributes.
XD's Earnings Growth And 33% ROE
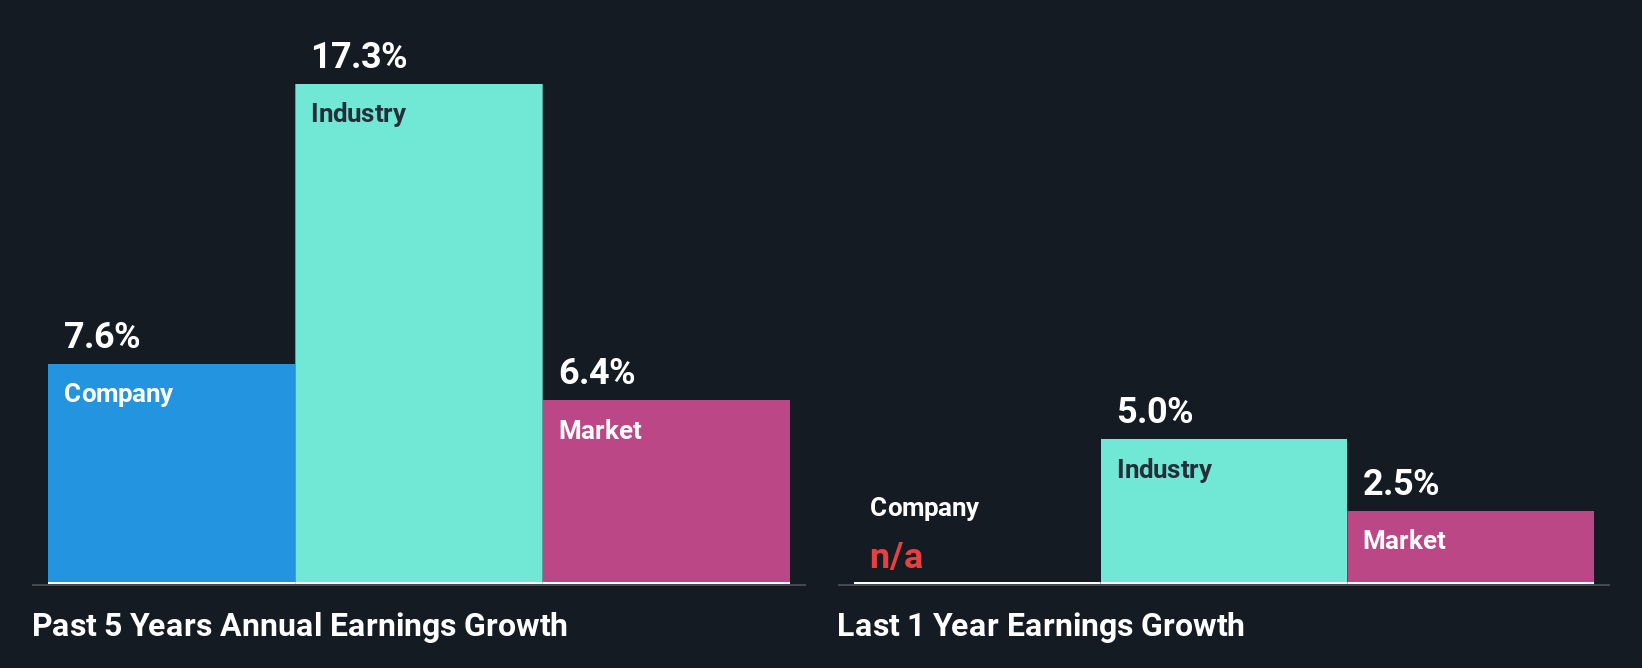
Firstly, we acknowledge that XD has a significantly high ROE. Secondly, even when compared to the industry average of 8.9% the company's ROE is quite impressive. Probably as a result of this, XD was able to see a decent net income growth of 7.6% over the last five years.
As a next step, we compared XD's net income growth with the industry and were disappointed to see that the company's growth is lower than the industry average growth of 17% in the same period.
Earnings growth is an important metric to consider when valuing a stock. It’s important for an investor to know whether the market has priced in the company's expected earnings growth (or decline). This then helps them determine if the stock is placed for a bright or bleak future. One good indicator of expected earnings growth is the P/E ratio which determines the price the market is willing to pay for a stock based on its earnings prospects. So, you may want to check if XD is trading on a high P/E or a low P/E, relative to its industry.
Is XD Using Its Retained Earnings Effectively?
In XD's case, its respectable earnings growth can probably be explained by its low three-year median payout ratio of 22% (or a retention ratio of 78%), which suggests that the company is investing most of its profits to grow its business.
Our latest analyst data shows that the future payout ratio of the company over the next three years is expected to be approximately 21%. Still, forecasts suggest that XD's future ROE will drop to 24% even though the the company's payout ratio is not expected to change by much.
Summary
On the whole, we feel that XD's performance has been quite good. In particular, it's great to see that the company is investing heavily into its business and along with a high rate of return, that has resulted in a respectable growth in its earnings. Having said that, looking at the current analyst estimates, we found that the company's earnings are expected to gain momentum. To know more about the latest analysts predictions for the company, check out this visualization of analyst forecasts for the company.
New: AI Stock Screener & Alerts
Our new AI Stock Screener scans the market every day to uncover opportunities.
• Dividend Powerhouses (3%+ Yield)• Undervalued Small Caps with Insider Buying• High growth Tech and AI CompaniesOr build your own from over 50 metrics.
Explore Now for FreeHave feedback on this article? Concerned about the content? Get in touch with us directly. Alternatively, email editorial-team (at) simplywallst.com.This article by Simply Wall St is general in nature. We provide commentary based on historical data and analyst forecasts only using an unbiased methodology and our articles are not intended to be financial advice. It does not constitute a recommendation to buy or sell any stock, and does not take account of your objectives, or your financial situation. We aim to bring you long-term focused analysis driven by fundamental data. Note that our analysis may not factor in the latest price-sensitive company announcements or qualitative material. Simply Wall St has no position in any stocks mentioned.
Disclaimer: Investing carries risk. This is not financial advice. The above content should not be regarded as an offer, recommendation, or solicitation on acquiring or disposing of any financial products, any associated discussions, comments, or posts by author or other users should not be considered as such either. It is solely for general information purpose only, which does not consider your own investment objectives, financial situations or needs. TTM assumes no responsibility or warranty for the accuracy and completeness of the information, investors should do their own research and may seek professional advice before investing.
Most Discussed
- 1
- 2
- 3
- 4
- 5
- 6
- 7
- 8
- 9
- 10