These 4 Measures Indicate That Transcat (NASDAQ:TRNS) Is Using Debt Reasonably Well
Legendary fund manager Li Lu (who Charlie Munger backed) once said, 'The biggest investment risk is not the volatility of prices, but whether you will suffer a permanent loss of capital.' When we think about how risky a company is, we always like to look at its use of debt, since debt overload can lead to ruin. Importantly, Transcat, Inc. (NASDAQ:TRNS) does carry debt. But is this debt a concern to shareholders?
Trump has pledged to "unleash" American oil and gas and these 15 US stocks have developments that are poised to benefit.
When Is Debt A Problem?
Debt is a tool to help businesses grow, but if a business is incapable of paying off its lenders, then it exists at their mercy. Ultimately, if the company can't fulfill its legal obligations to repay debt, shareholders could walk away with nothing. However, a more usual (but still expensive) situation is where a company must dilute shareholders at a cheap share price simply to get debt under control. Of course, the upside of debt is that it often represents cheap capital, especially when it replaces dilution in a company with the ability to reinvest at high rates of return. When we think about a company's use of debt, we first look at cash and debt together.
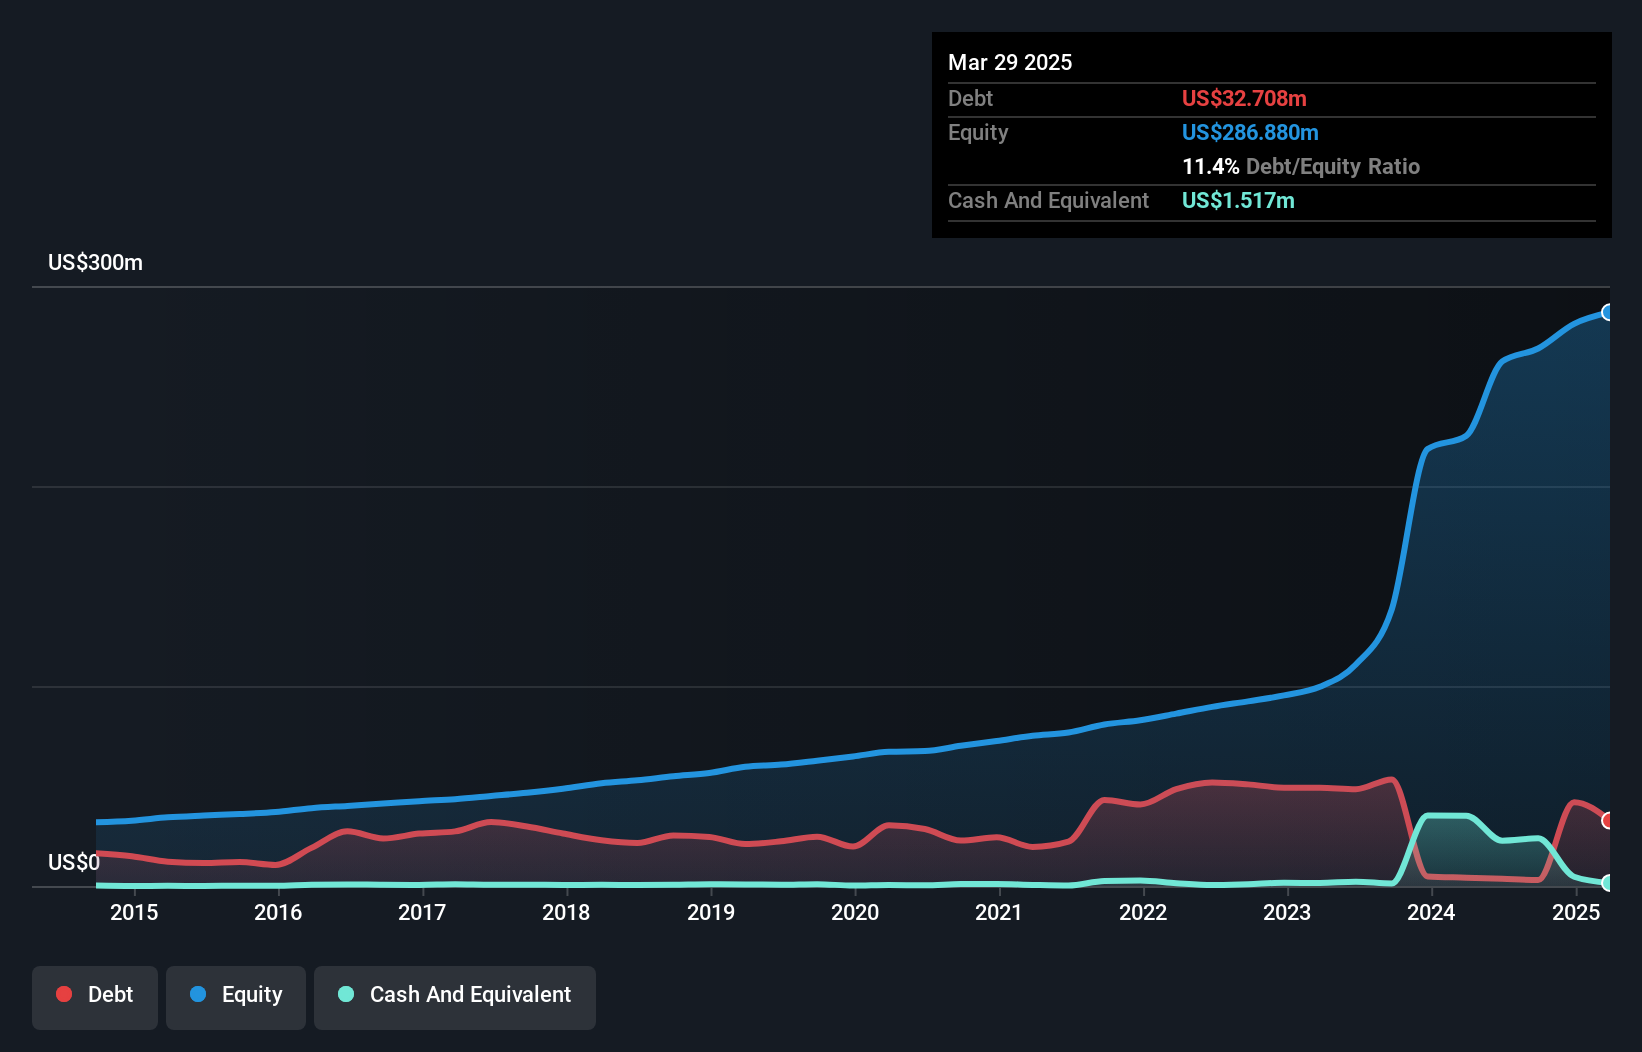
What Is Transcat's Net Debt?
You can click the graphic below for the historical numbers, but it shows that as of March 2025 Transcat had US$32.7m of debt, an increase on US$4.16m, over one year. However, it does have US$1.52m in cash offsetting this, leading to net debt of about US$31.2m.
A Look At Transcat's Liabilities
According to the last reported balance sheet, Transcat had liabilities of US$34.0m due within 12 months, and liabilities of US$64.3m due beyond 12 months. Offsetting this, it had US$1.52m in cash and US$56.3m in receivables that were due within 12 months. So its liabilities total US$40.5m more than the combination of its cash and short-term receivables.
Of course, Transcat has a market capitalization of US$757.4m, so these liabilities are probably manageable. However, we do think it is worth keeping an eye on its balance sheet strength, as it may change over time.
Check out our latest analysis for Transcat
We use two main ratios to inform us about debt levels relative to earnings. The first is net debt divided by earnings before interest, tax, depreciation, and amortization (EBITDA), while the second is how many times its earnings before interest and tax (EBIT) covers its interest expense (or its interest cover, for short). Thus we consider debt relative to earnings both with and without depreciation and amortization expenses.
Transcat has a low debt to EBITDA ratio of only 0.85. But the really cool thing is that it actually managed to receive more interest than it paid, over the last year. So it's fair to say it can handle debt like a hotshot teppanyaki chef handles cooking. But the bad news is that Transcat has seen its EBIT plunge 15% in the last twelve months. We think hat kind of performance, if repeated frequently, could well lead to difficulties for the stock. The balance sheet is clearly the area to focus on when you are analysing debt. But it is future earnings, more than anything, that will determine Transcat's ability to maintain a healthy balance sheet going forward. So if you want to see what the professionals think, you might find this free report on analyst profit forecasts to be interesting.
Finally, a company can only pay off debt with cold hard cash, not accounting profits. So the logical step is to look at the proportion of that EBIT that is matched by actual free cash flow. During the last three years, Transcat generated free cash flow amounting to a very robust 94% of its EBIT, more than we'd expect. That positions it well to pay down debt if desirable to do so.
Our View
Happily, Transcat's impressive interest cover implies it has the upper hand on its debt. But we must concede we find its EBIT growth rate has the opposite effect. When we consider the range of factors above, it looks like Transcat is pretty sensible with its use of debt. While that brings some risk, it can also enhance returns for shareholders. Above most other metrics, we think its important to track how fast earnings per share is growing, if at all. If you've also come to that realization, you're in luck, because today you can view this interactive graph of Transcat's earnings per share history for free.
At the end of the day, it's often better to focus on companies that are free from net debt. You can access our special list of such companies (all with a track record of profit growth). It's free.
Valuation is complex, but we're here to simplify it.
Discover if Transcat might be undervalued or overvalued with our detailed analysis, featuring fair value estimates, potential risks, dividends, insider trades, and its financial condition.
Access Free AnalysisHave feedback on this article? Concerned about the content? Get in touch with us directly. Alternatively, email editorial-team (at) simplywallst.com.This article by Simply Wall St is general in nature. We provide commentary based on historical data and analyst forecasts only using an unbiased methodology and our articles are not intended to be financial advice. It does not constitute a recommendation to buy or sell any stock, and does not take account of your objectives, or your financial situation. We aim to bring you long-term focused analysis driven by fundamental data. Note that our analysis may not factor in the latest price-sensitive company announcements or qualitative material. Simply Wall St has no position in any stocks mentioned.
Disclaimer: Investing carries risk. This is not financial advice. The above content should not be regarded as an offer, recommendation, or solicitation on acquiring or disposing of any financial products, any associated discussions, comments, or posts by author or other users should not be considered as such either. It is solely for general information purpose only, which does not consider your own investment objectives, financial situations or needs. TTM assumes no responsibility or warranty for the accuracy and completeness of the information, investors should do their own research and may seek professional advice before investing.
Most Discussed
- 1
- 2
- 3
- 4
- 5
- 6
- 7
- 8
- 9
- 10