Undiscovered Gems In Asia To Watch This July 2025
As global markets navigate a complex landscape marked by consumer inflation in the U.S. and mixed performances across major indices, Asia's small-cap sector presents intriguing opportunities for investors seeking growth potential amid economic shifts. With China's GDP showing resilience and Japan's stock markets experiencing modest gains, discerning investors may find value in stocks that demonstrate strong fundamentals and adaptability to evolving market conditions.
Top 10 Undiscovered Gems With Strong Fundamentals In Asia
| Name | Debt To Equity | Revenue Growth | Earnings Growth | Health Rating |
|---|---|---|---|---|
| AOKI Holdings | 25.32% | 5.06% | 57.58% | ★★★★★★ |
| Hubei Three Gorges Tourism Group | 11.24% | -15.32% | 17.90% | ★★★★★★ |
| Xinjiang Torch Gas | 0.78% | 16.31% | 14.06% | ★★★★★★ |
| Ampire | NA | -2.21% | 8.00% | ★★★★★★ |
| TCM Biotech International | 2.98% | 5.76% | -0.13% | ★★★★★★ |
| Showbox | NA | 10.08% | 7.87% | ★★★★★★ |
| Tokyo Tekko | 8.47% | 8.06% | 24.39% | ★★★★★☆ |
| Hong Leong Finance | 0.07% | 6.89% | 6.61% | ★★★★★☆ |
| Iljin DiamondLtd | 2.55% | -3.23% | 0.91% | ★★★★☆☆ |
| Shenzhen Leaguer | 63.12% | 1.96% | -16.52% | ★★★★☆☆ |
Click here to see the full list of 2611 stocks from our Asian Undiscovered Gems With Strong Fundamentals screener.
Below we spotlight a couple of our favorites from our exclusive screener.
Kinetic Development Group (SEHK:1277)
Simply Wall St Value Rating: ★★★★★☆
Overview: Kinetic Development Group Limited is an investment holding company focused on the extraction and sale of coal products in the People’s Republic of China, with a market capitalization of HK$11.38 billion.
Operations: The company's primary revenue stream is from coal mining, generating CN¥5.37 billion. The net profit margin reflects the company's profitability in its operations.
Kinetic Development Group, a small cap player in the oil and gas sector, is trading at 61.2% below its estimated fair value, suggesting potential undervaluation. Over the past year, earnings grew by 1.5%, outpacing the industry average of -1.1%. The company's debt to equity ratio improved from 15.8% to 10.6% over five years, indicating better financial health with more cash than total debt on hand. Recent dividend adjustments saw a decrease to HKD 4.5 cents per share for 2024, reflecting cautious capital management amidst its growth trajectory and high-quality earnings profile.
- Click here and access our complete health analysis report to understand the dynamics of Kinetic Development Group.
Learn about Kinetic Development Group's historical performance.

Jones Tech (SZSE:300684)
Simply Wall St Value Rating: ★★★★★★
Overview: Jones Tech PLC offers materials solutions for intelligent electronic equipment across Asia, Europe, and America with a market cap of CN¥8.59 billion.
Operations: Jones Tech PLC generates revenue through its materials solutions for intelligent electronic equipment. The company has a market cap of CN¥8.59 billion, reflecting its presence across Asia, Europe, and America.
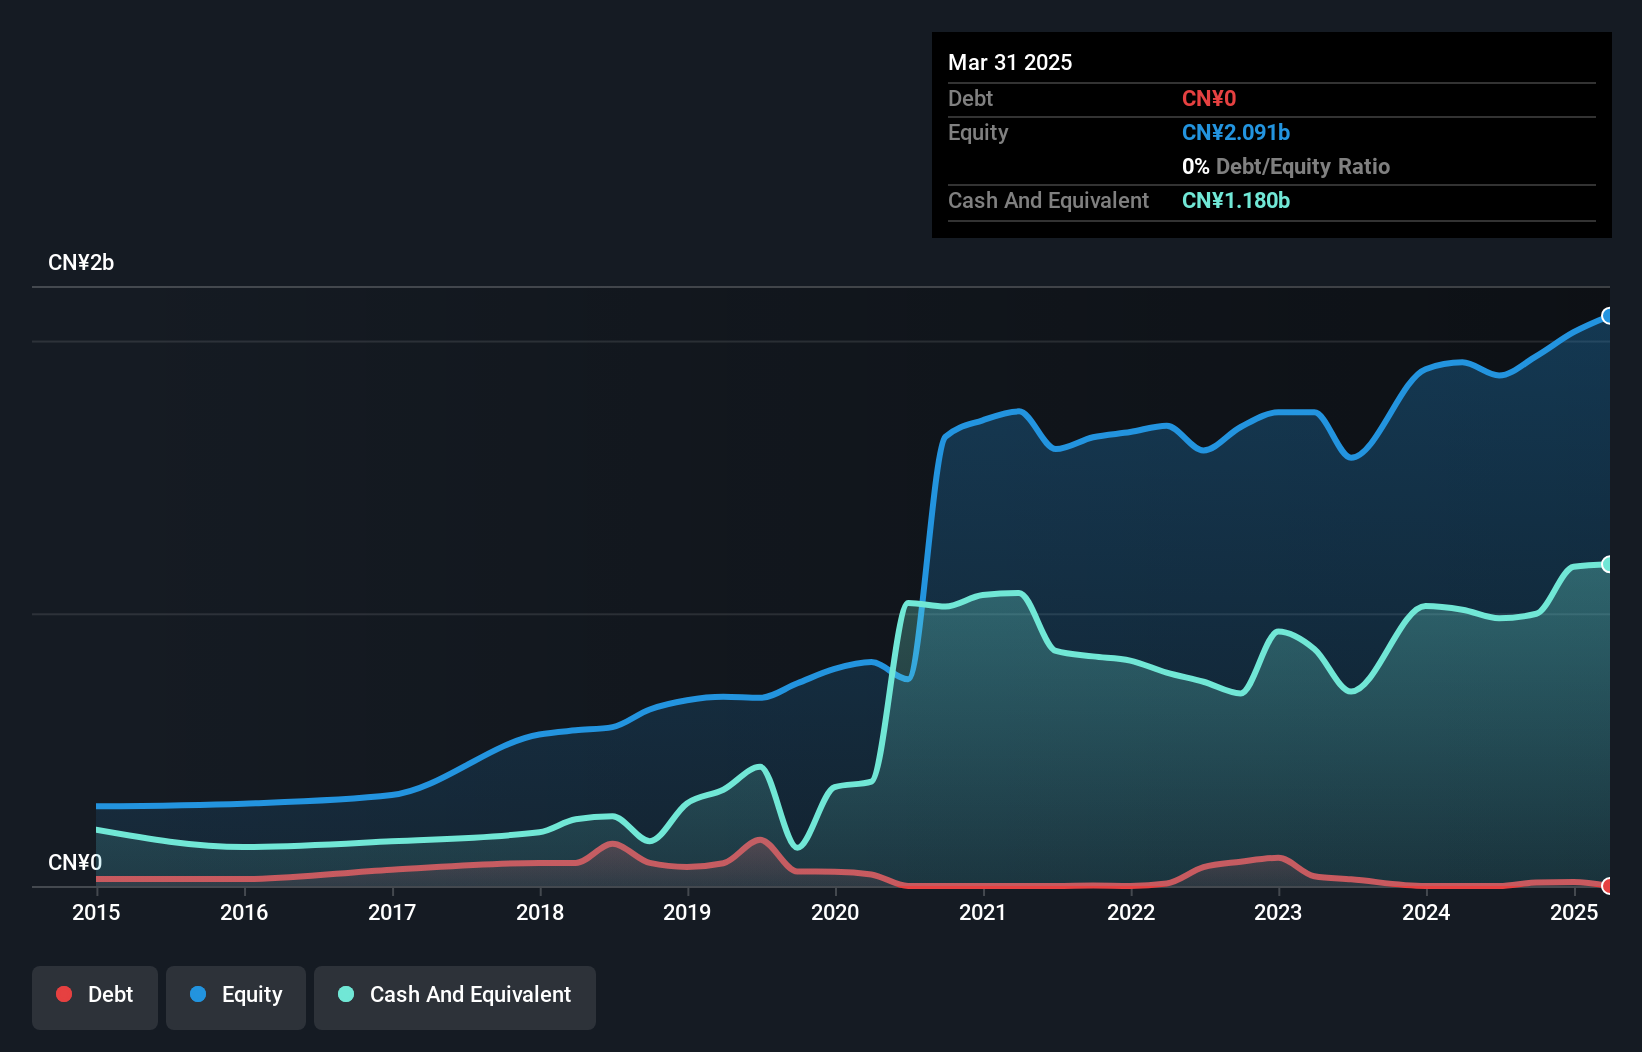
Jones Tech, a nimble player in the electronics sector, has shown remarkable earnings growth of 182% over the past year, outpacing the industry average of 2.9%. This debt-free company offers high-quality earnings and trades at a price-to-earnings ratio of 36.8x, which is favorable compared to the CN market's 41.8x. Recent activities include a share buyback program where CNY 10.63 million was used to repurchase shares representing 0.15% of total shares from April to June 2025. Additionally, Jones Tech approved a cash dividend for shareholders at its recent annual meeting, reflecting solid shareholder returns and strategic financial management.
- Take a closer look at Jones Tech's potential here in our health report.
Gain insights into Jones Tech's past trends and performance with our Past report.
WuHu Foresight TechnologyLtd (SZSE:301529)
Simply Wall St Value Rating: ★★★★★☆
Overview: WuHu Foresight Technology Co., Ltd. focuses on the research, development, manufacture, and sale of automotive interior parts in China with a market cap of CN¥4.55 billion.
Operations: WuHu Foresight Technology Co., Ltd. generates revenue primarily from the sale of auto parts and accessories, amounting to CN¥1.49 billion. The company's financial performance is influenced by its cost structure and market dynamics within the automotive sector in China.
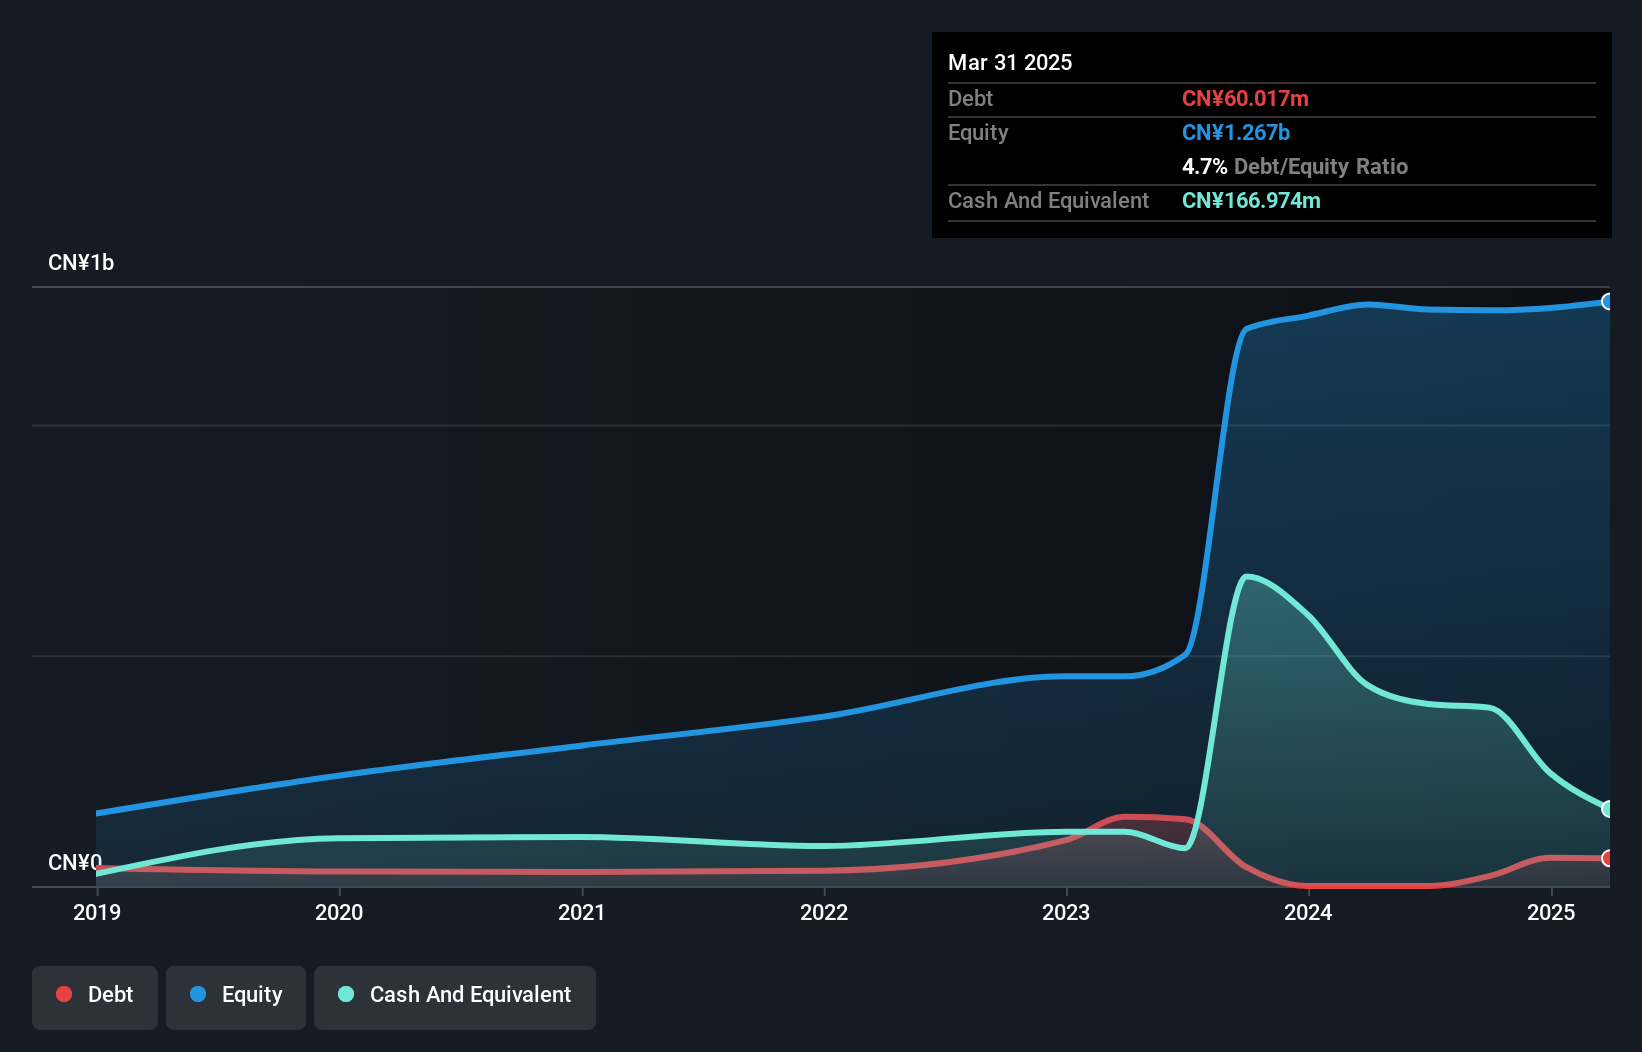
WuHu Foresight Technology, a small player in the auto components sector, has demonstrated impressive earnings growth of 12% over the past year, outpacing the industry average of 4.7%. Despite its highly volatile share price recently, it managed to reduce its debt-to-equity ratio from 12.2% to 4.7% over five years. The company reported first-quarter sales of CNY 418.1 million and net income rose to CNY 27.97 million from CNY 23.81 million a year prior, with basic earnings per share increasing to CNY 0.33 from CNY 0.28 last year, reflecting strong operational performance amidst ongoing financial challenges like negative free cash flow and high capital expenditure levels.
- Navigate through the intricacies of WuHu Foresight TechnologyLtd with our comprehensive health report here.
Explore historical data to track WuHu Foresight TechnologyLtd's performance over time in our Past section.
Key Takeaways
- Click this link to deep-dive into the 2611 companies within our Asian Undiscovered Gems With Strong Fundamentals screener.
- Got skin in the game with these stocks? Elevate how you manage them by using Simply Wall St's portfolio, where intuitive tools await to help optimize your investment outcomes.
- Invest smarter with the free Simply Wall St app providing detailed insights into every stock market around the globe.
Contemplating Other Strategies?
- Explore high-performing small cap companies that haven't yet garnered significant analyst attention.
- Fuel your portfolio with companies showing strong growth potential, backed by optimistic outlooks both from analysts and management.
- Find companies with promising cash flow potential yet trading below their fair value.
This article by Simply Wall St is general in nature. We provide commentary based on historical data and analyst forecasts only using an unbiased methodology and our articles are not intended to be financial advice. It does not constitute a recommendation to buy or sell any stock, and does not take account of your objectives, or your financial situation. We aim to bring you long-term focused analysis driven by fundamental data. Note that our analysis may not factor in the latest price-sensitive company announcements or qualitative material. Simply Wall St has no position in any stocks mentioned.
Valuation is complex, but we're here to simplify it.
Discover if Kinetic Development Group might be undervalued or overvalued with our detailed analysis, featuring fair value estimates, potential risks, dividends, insider trades, and its financial condition.
Access Free AnalysisHave feedback on this article? Concerned about the content? Get in touch with us directly. Alternatively, email editorial-team@simplywallst.com
Disclaimer: Investing carries risk. This is not financial advice. The above content should not be regarded as an offer, recommendation, or solicitation on acquiring or disposing of any financial products, any associated discussions, comments, or posts by author or other users should not be considered as such either. It is solely for general information purpose only, which does not consider your own investment objectives, financial situations or needs. TTM assumes no responsibility or warranty for the accuracy and completeness of the information, investors should do their own research and may seek professional advice before investing.
Most Discussed
- 1
- 2
- 3
- 4
- 5
- 6
- 7
- 8
- 9
- 10