Investors Appear Satisfied With AF Global Limited's (SGX:L38) Prospects As Shares Rocket 27%
The AF Global Limited (SGX:L38) share price has done very well over the last month, posting an excellent gain of 27%. Not all shareholders will be feeling jubilant, since the share price is still down a very disappointing 17% in the last twelve months.
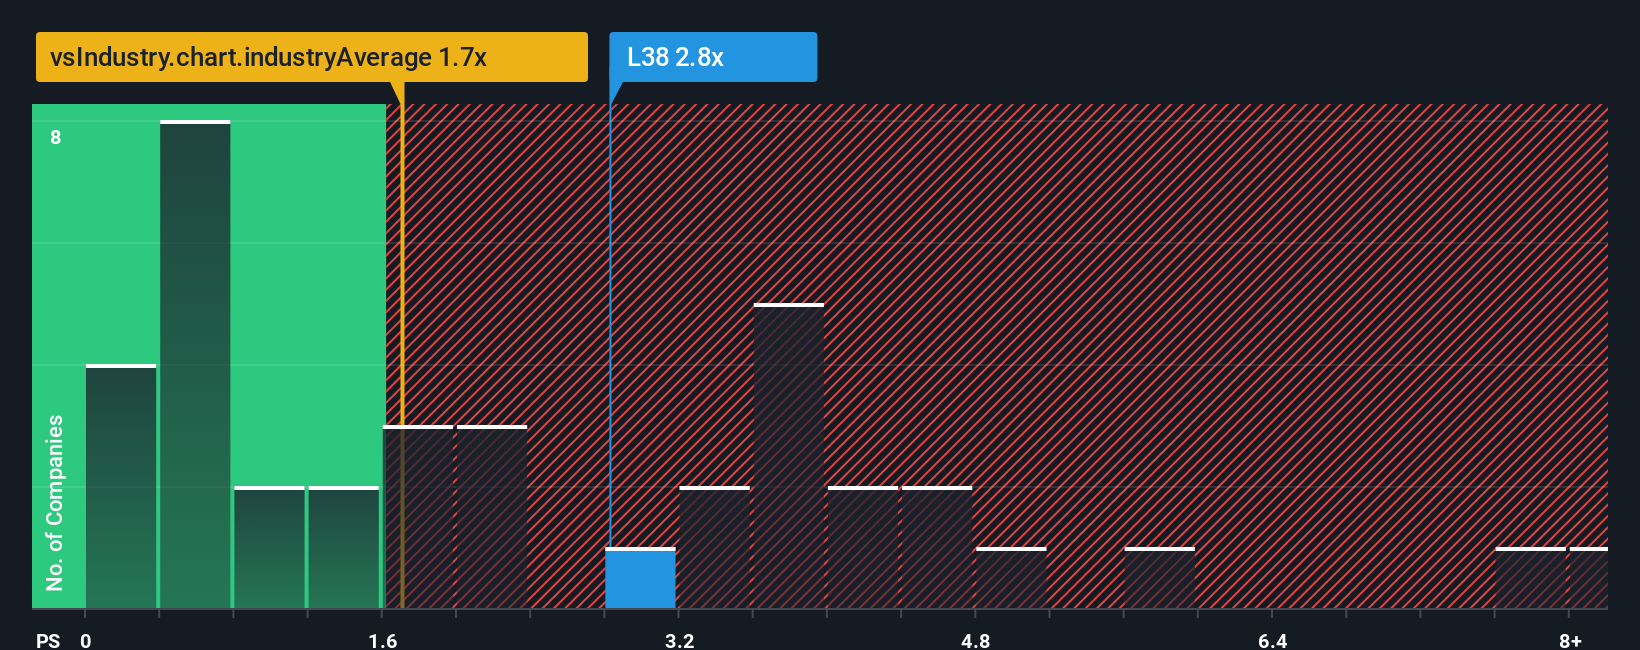
Since its price has surged higher, given close to half the companies operating in Singapore's Hospitality industry have price-to-sales ratios (or "P/S") below 1.7x, you may consider AF Global as a stock to potentially avoid with its 2.8x P/S ratio. Nonetheless, we'd need to dig a little deeper to determine if there is a rational basis for the elevated P/S.
This technology could replace computers: discover the 20 stocks are working to make quantum computing a reality.
See our latest analysis for AF Global
What Does AF Global's P/S Mean For Shareholders?
The revenue growth achieved at AF Global over the last year would be more than acceptable for most companies. One possibility is that the P/S ratio is high because investors think this respectable revenue growth will be enough to outperform the broader industry in the near future. You'd really hope so, otherwise you're paying a pretty hefty price for no particular reason.
Although there are no analyst estimates available for AF Global, take a look at this free data-rich visualisation to see how the company stacks up on earnings, revenue and cash flow.What Are Revenue Growth Metrics Telling Us About The High P/S?
There's an inherent assumption that a company should outperform the industry for P/S ratios like AF Global's to be considered reasonable.
If we review the last year of revenue growth, the company posted a worthy increase of 11%. While this performance is only fair, the company was still able to deliver immense revenue growth over the last three years. Therefore, it's fair to say the revenue growth recently has been superb for the company.
This is in contrast to the rest of the industry, which is expected to grow by 16% over the next year, materially lower than the company's recent medium-term annualised growth rates.
In light of this, it's understandable that AF Global's P/S sits above the majority of other companies. Presumably shareholders aren't keen to offload something they believe will continue to outmanoeuvre the wider industry.
The Final Word
AF Global shares have taken a big step in a northerly direction, but its P/S is elevated as a result. Generally, our preference is to limit the use of the price-to-sales ratio to establishing what the market thinks about the overall health of a company.
It's no surprise that AF Global can support its high P/S given the strong revenue growth its experienced over the last three-year is superior to the current industry outlook. In the eyes of shareholders, the probability of a continued growth trajectory is great enough to prevent the P/S from pulling back. If recent medium-term revenue trends continue, it's hard to see the share price falling strongly in the near future under these circumstances.
Before you settle on your opinion, we've discovered 2 warning signs for AF Global that you should be aware of.
If strong companies turning a profit tickle your fancy, then you'll want to check out this free list of interesting companies that trade on a low P/E (but have proven they can grow earnings).
New: Manage All Your Stock Portfolios in One Place
We've created the ultimate portfolio companion for stock investors, and it's free.
• Connect an unlimited number of Portfolios and see your total in one currency• Be alerted to new Warning Signs or Risks via email or mobile• Track the Fair Value of your stocks
Try a Demo Portfolio for FreeHave feedback on this article? Concerned about the content? Get in touch with us directly. Alternatively, email editorial-team (at) simplywallst.com.This article by Simply Wall St is general in nature. We provide commentary based on historical data and analyst forecasts only using an unbiased methodology and our articles are not intended to be financial advice. It does not constitute a recommendation to buy or sell any stock, and does not take account of your objectives, or your financial situation. We aim to bring you long-term focused analysis driven by fundamental data. Note that our analysis may not factor in the latest price-sensitive company announcements or qualitative material. Simply Wall St has no position in any stocks mentioned.
Disclaimer: Investing carries risk. This is not financial advice. The above content should not be regarded as an offer, recommendation, or solicitation on acquiring or disposing of any financial products, any associated discussions, comments, or posts by author or other users should not be considered as such either. It is solely for general information purpose only, which does not consider your own investment objectives, financial situations or needs. TTM assumes no responsibility or warranty for the accuracy and completeness of the information, investors should do their own research and may seek professional advice before investing.
Most Discussed
- 1
- 2
- 3
- 4
- 5
- 6
- 7
- 8
- 9
- 10