Vector Limited's (NZSE:VCT) Has Been On A Rise But Financial Prospects Look Weak: Is The Stock Overpriced?
Vector (NZSE:VCT) has had a great run on the share market with its stock up by a significant 10.0% over the last three months. However, we decided to pay close attention to its weak financials as we are doubtful that the current momentum will keep up, given the scenario. Particularly, we will be paying attention to Vector's ROE today.
ROE or return on equity is a useful tool to assess how effectively a company can generate returns on the investment it received from its shareholders. In simpler terms, it measures the profitability of a company in relation to shareholder's equity.
We've found 21 US stocks that are forecast to pay a dividend yield of over 6% next year. See the full list for free.
How Do You Calculate Return On Equity?
Return on equity can be calculated by using the formula:
Return on Equity = Net Profit (from continuing operations) ÷ Shareholders' Equity
So, based on the above formula, the ROE for Vector is:
4.8% = NZ$179m ÷ NZ$3.7b (Based on the trailing twelve months to December 2024).
The 'return' is the amount earned after tax over the last twelve months. So, this means that for every NZ$1 of its shareholder's investments, the company generates a profit of NZ$0.05.
View our latest analysis for Vector
What Is The Relationship Between ROE And Earnings Growth?
We have already established that ROE serves as an efficient profit-generating gauge for a company's future earnings. Based on how much of its profits the company chooses to reinvest or "retain", we are then able to evaluate a company's future ability to generate profits. Generally speaking, other things being equal, firms with a high return on equity and profit retention, have a higher growth rate than firms that don’t share these attributes.
Vector's Earnings Growth And 4.8% ROE
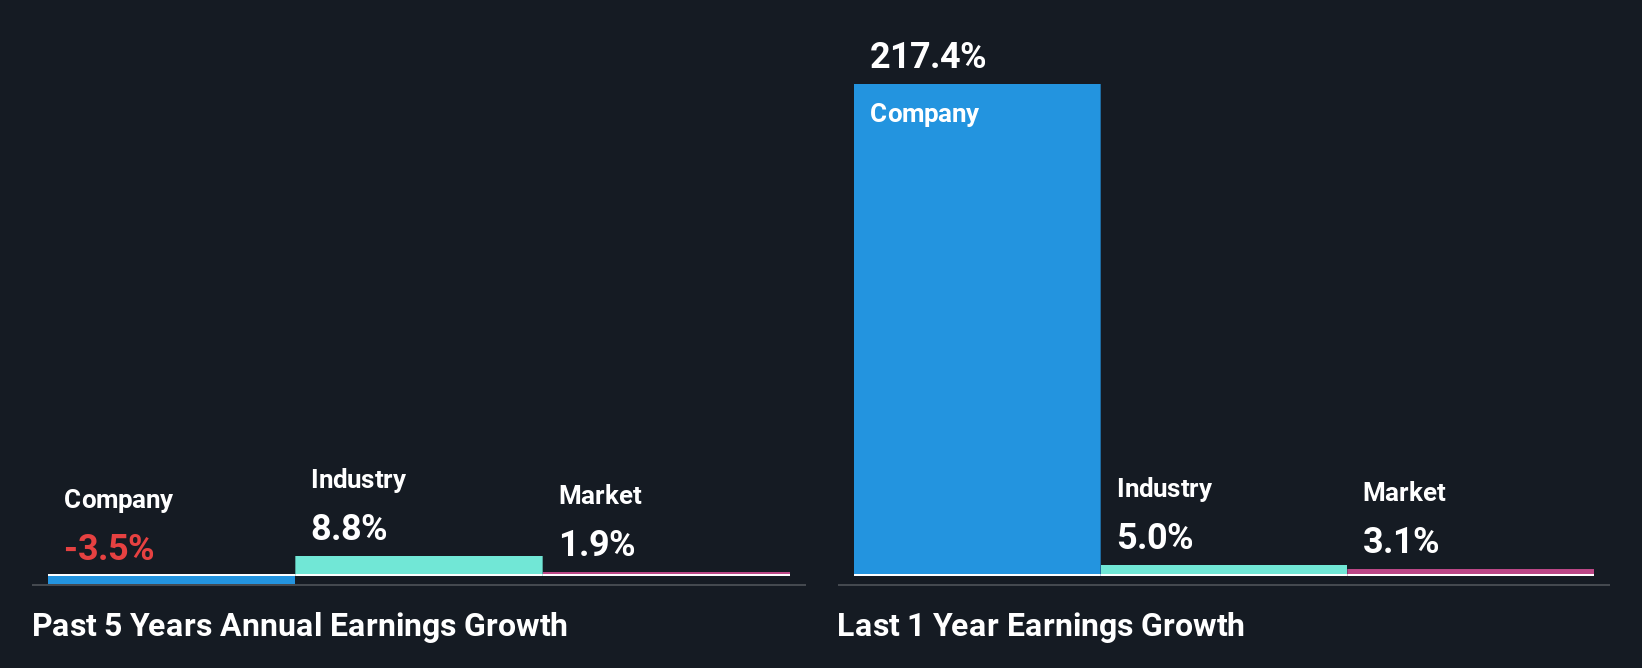
As you can see, Vector's ROE looks pretty weak. Even compared to the average industry ROE of 9.8%, the company's ROE is quite dismal. For this reason, Vector's five year net income decline of 3.5% is not surprising given its lower ROE. We believe that there also might be other aspects that are negatively influencing the company's earnings prospects. Such as - low earnings retention or poor allocation of capital.
So, as a next step, we compared Vector's performance against the industry and were disappointed to discover that while the company has been shrinking its earnings, the industry has been growing its earnings at a rate of 8.8% over the last few years.
The basis for attaching value to a company is, to a great extent, tied to its earnings growth. It’s important for an investor to know whether the market has priced in the company's expected earnings growth (or decline). Doing so will help them establish if the stock's future looks promising or ominous. Has the market priced in the future outlook for VCT? You can find out in our latest intrinsic value infographic research report.
Is Vector Using Its Retained Earnings Effectively?
Vector's very high three-year median payout ratio of 188% over the last three years suggests that the company is paying its shareholders more than what it is earning and this explains the company's shrinking earnings. Paying a dividend higher than reported profits is not a sustainable move. Our risks dashboard should have the 2 risks we have identified for Vector.
Additionally, Vector has paid dividends over a period of at least ten years, which means that the company's management is determined to pay dividends even if it means little to no earnings growth. Existing analyst estimates suggest that the company's future payout ratio is expected to drop to 100% over the next three years. The fact that the company's ROE is expected to rise to 7.7% over the same period is explained by the drop in the payout ratio.
Summary
In total, we would have a hard think before deciding on any investment action concerning Vector. Particularly, its ROE is a huge disappointment, not to mention its lack of proper reinvestment into the business. As a result its earnings growth has also been quite disappointing. With that said, we studied the latest analyst forecasts and found that while the company has shrunk its earnings in the past, analysts expect its earnings to grow in the future. To know more about the latest analysts predictions for the company, check out this visualization of analyst forecasts for the company.
New: Manage All Your Stock Portfolios in One Place
We've created the ultimate portfolio companion for stock investors, and it's free.
• Connect an unlimited number of Portfolios and see your total in one currency• Be alerted to new Warning Signs or Risks via email or mobile• Track the Fair Value of your stocks
Try a Demo Portfolio for FreeHave feedback on this article? Concerned about the content? Get in touch with us directly. Alternatively, email editorial-team (at) simplywallst.com.This article by Simply Wall St is general in nature. We provide commentary based on historical data and analyst forecasts only using an unbiased methodology and our articles are not intended to be financial advice. It does not constitute a recommendation to buy or sell any stock, and does not take account of your objectives, or your financial situation. We aim to bring you long-term focused analysis driven by fundamental data. Note that our analysis may not factor in the latest price-sensitive company announcements or qualitative material. Simply Wall St has no position in any stocks mentioned.
Disclaimer: Investing carries risk. This is not financial advice. The above content should not be regarded as an offer, recommendation, or solicitation on acquiring or disposing of any financial products, any associated discussions, comments, or posts by author or other users should not be considered as such either. It is solely for general information purpose only, which does not consider your own investment objectives, financial situations or needs. TTM assumes no responsibility or warranty for the accuracy and completeness of the information, investors should do their own research and may seek professional advice before investing.
Most Discussed
- 1
- 2
- 3
- 4
- 5
- 6
- 7
- 8
- 9
- 10