Does The Market Have A Low Tolerance For Wiseway Group Limited's (ASX:WWG) Mixed Fundamentals?
It is hard to get excited after looking at Wiseway Group's (ASX:WWG) recent performance, when its stock has declined 19% over the past month. We, however decided to study the company's financials to determine if they have got anything to do with the price decline. Fundamentals usually dictate market outcomes so it makes sense to study the company's financials. In this article, we decided to focus on Wiseway Group's ROE.
ROE or return on equity is a useful tool to assess how effectively a company can generate returns on the investment it received from its shareholders. In short, ROE shows the profit each dollar generates with respect to its shareholder investments.
This technology could replace computers: discover the 20 stocks are working to make quantum computing a reality.
How Is ROE Calculated?
The formula for return on equity is:
Return on Equity = Net Profit (from continuing operations) ÷ Shareholders' Equity
So, based on the above formula, the ROE for Wiseway Group is:
6.5% = AU$1.3m ÷ AU$21m (Based on the trailing twelve months to December 2024).
The 'return' refers to a company's earnings over the last year. That means that for every A$1 worth of shareholders' equity, the company generated A$0.06 in profit.
Check out our latest analysis for Wiseway Group
Why Is ROE Important For Earnings Growth?
So far, we've learned that ROE is a measure of a company's profitability. We now need to evaluate how much profit the company reinvests or "retains" for future growth which then gives us an idea about the growth potential of the company. Assuming everything else remains unchanged, the higher the ROE and profit retention, the higher the growth rate of a company compared to companies that don't necessarily bear these characteristics.
Wiseway Group's Earnings Growth And 6.5% ROE
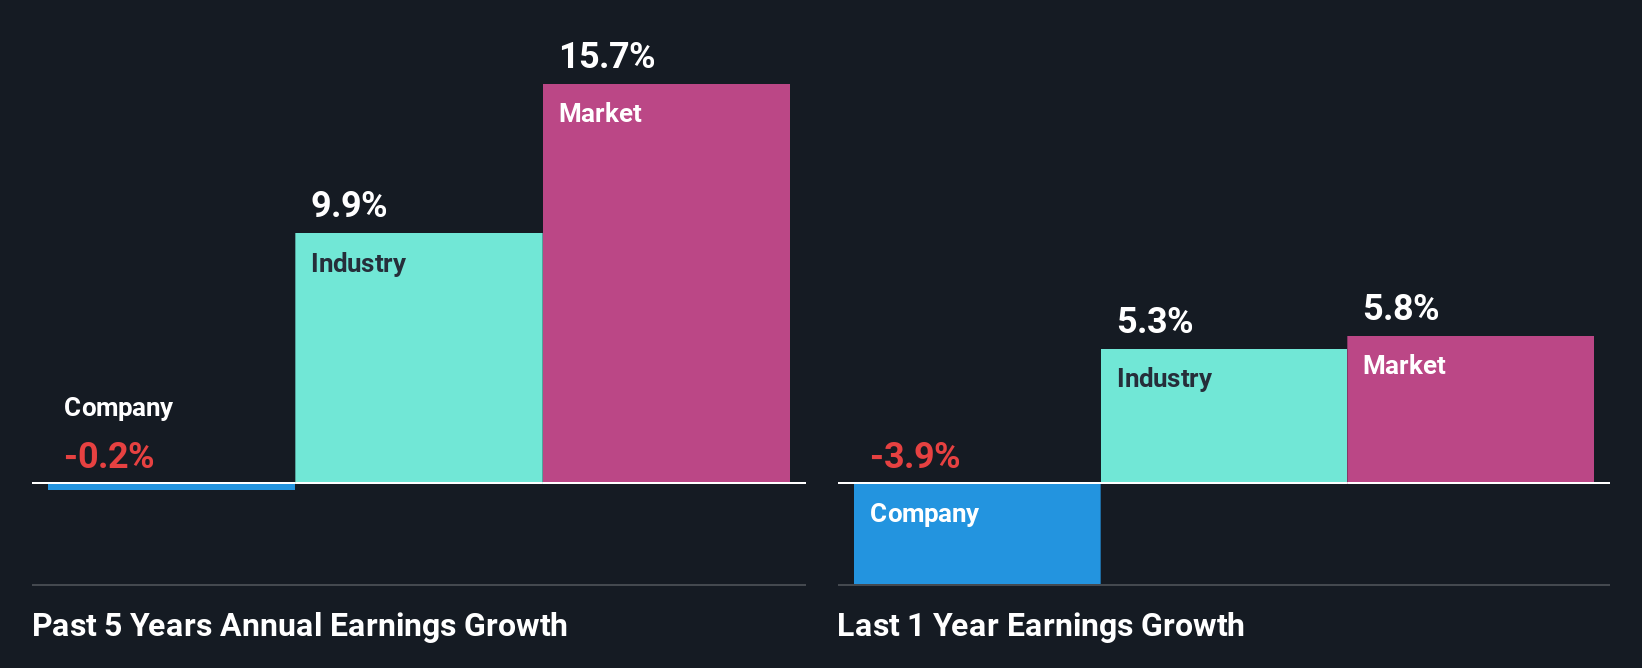
At first glance, Wiseway Group's ROE doesn't look very promising. Next, when compared to the average industry ROE of 12%, the company's ROE leaves us feeling even less enthusiastic. As a result, Wiseway Group's flat net income growth over the past five years doesn't come as a surprise given its lower ROE.
As a next step, we compared Wiseway Group's net income growth with the industry and discovered that the industry saw an average growth of 9.9% in the same period.
Earnings growth is an important metric to consider when valuing a stock. The investor should try to establish if the expected growth or decline in earnings, whichever the case may be, is priced in. Doing so will help them establish if the stock's future looks promising or ominous. If you're wondering about Wiseway Group's's valuation, check out this gauge of its price-to-earnings ratio, as compared to its industry.
Is Wiseway Group Making Efficient Use Of Its Profits?
In spite of a normal three-year median payout ratio of 31% (or a retention ratio of 69%), Wiseway Group hasn't seen much growth in its earnings. So there might be other factors at play here which could potentially be hampering growth. For example, the business has faced some headwinds.
In addition, Wiseway Group only recently started paying a dividend so the management must have decided the shareholders prefer dividends over earnings growth.
Conclusion
In total, we're a bit ambivalent about Wiseway Group's performance. While the company does have a high rate of reinvestment, the low ROE means that all that reinvestment is not reaping any benefit to its investors, and moreover, its having a negative impact on the earnings growth. So far, we've only made a quick discussion around the company's earnings growth. So it may be worth checking this free detailed graph of Wiseway Group's past earnings, as well as revenue and cash flows to get a deeper insight into the company's performance.
Valuation is complex, but we're here to simplify it.
Discover if Wiseway Group might be undervalued or overvalued with our detailed analysis, featuring fair value estimates, potential risks, dividends, insider trades, and its financial condition.
Access Free AnalysisHave feedback on this article? Concerned about the content? Get in touch with us directly. Alternatively, email editorial-team (at) simplywallst.com.This article by Simply Wall St is general in nature. We provide commentary based on historical data and analyst forecasts only using an unbiased methodology and our articles are not intended to be financial advice. It does not constitute a recommendation to buy or sell any stock, and does not take account of your objectives, or your financial situation. We aim to bring you long-term focused analysis driven by fundamental data. Note that our analysis may not factor in the latest price-sensitive company announcements or qualitative material. Simply Wall St has no position in any stocks mentioned.
Disclaimer: Investing carries risk. This is not financial advice. The above content should not be regarded as an offer, recommendation, or solicitation on acquiring or disposing of any financial products, any associated discussions, comments, or posts by author or other users should not be considered as such either. It is solely for general information purpose only, which does not consider your own investment objectives, financial situations or needs. TTM assumes no responsibility or warranty for the accuracy and completeness of the information, investors should do their own research and may seek professional advice before investing.
Most Discussed
- 1
- 2
- 3
- 4
- 5
- 6
- 7
- 8
- 9
- 10