Sky Light Holdings Limited (HKG:3882) May Have Run Too Fast Too Soon With Recent 26% Price Plummet
The Sky Light Holdings Limited (HKG:3882) share price has fared very poorly over the last month, falling by a substantial 26%. Still, a bad month hasn't completely ruined the past year with the stock gaining 41%, which is great even in a bull market.
Even after such a large drop in price, when almost half of the companies in Hong Kong's Consumer Durables industry have price-to-sales ratios (or "P/S") below 0.5x, you may still consider Sky Light Holdings as a stock not worth researching with its 2.8x P/S ratio. Nonetheless, we'd need to dig a little deeper to determine if there is a rational basis for the highly elevated P/S.
Trump has pledged to "unleash" American oil and gas and these 15 US stocks have developments that are poised to benefit.
Check out our latest analysis for Sky Light Holdings
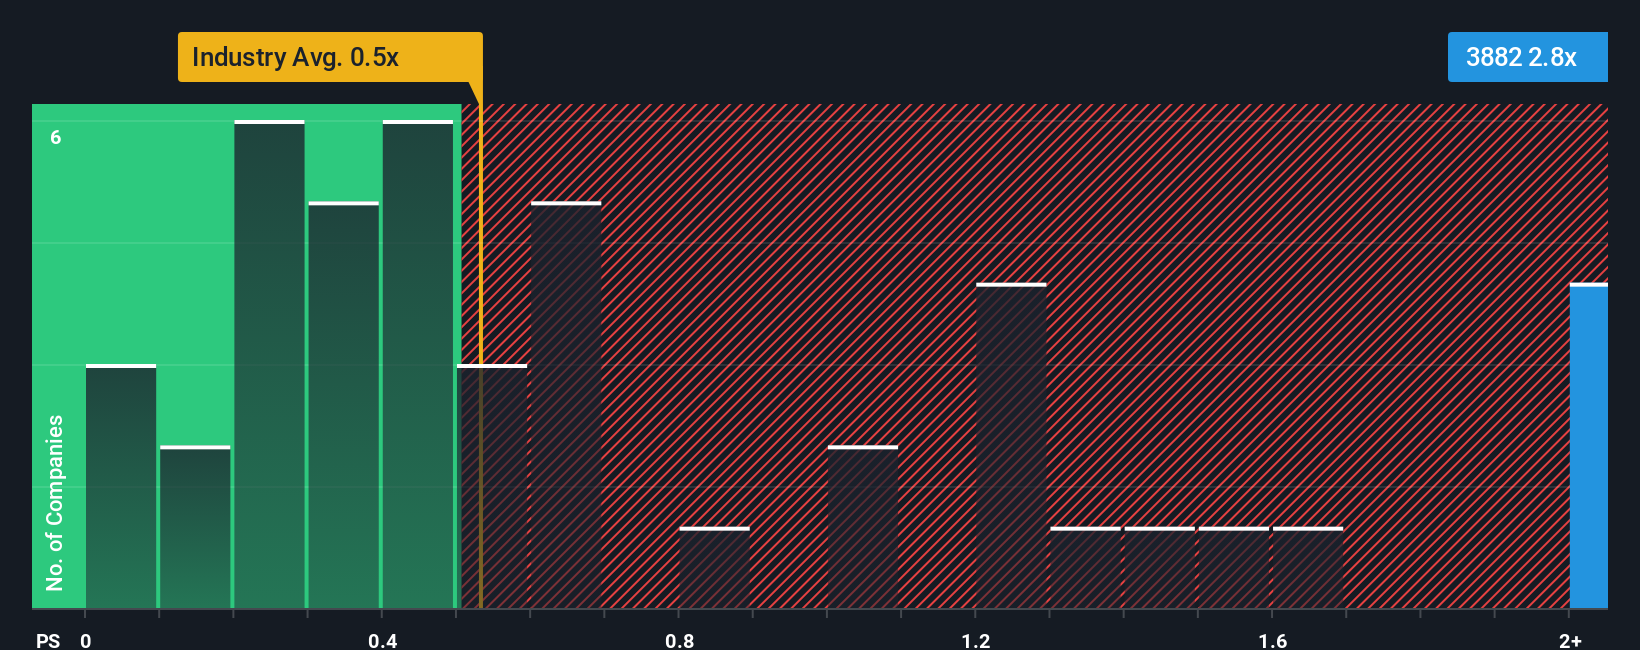
How Sky Light Holdings Has Been Performing
As an illustration, revenue has deteriorated at Sky Light Holdings over the last year, which is not ideal at all. Perhaps the market believes the company can do enough to outperform the rest of the industry in the near future, which is keeping the P/S ratio high. However, if this isn't the case, investors might get caught out paying too much for the stock.
Although there are no analyst estimates available for Sky Light Holdings, take a look at this free data-rich visualisation to see how the company stacks up on earnings, revenue and cash flow.Do Revenue Forecasts Match The High P/S Ratio?
There's an inherent assumption that a company should far outperform the industry for P/S ratios like Sky Light Holdings' to be considered reasonable.
In reviewing the last year of financials, we were disheartened to see the company's revenues fell to the tune of 3.8%. The last three years don't look nice either as the company has shrunk revenue by 59% in aggregate. Accordingly, shareholders would have felt downbeat about the medium-term rates of revenue growth.
Comparing that to the industry, which is predicted to deliver 8.8% growth in the next 12 months, the company's downward momentum based on recent medium-term revenue results is a sobering picture.
With this in mind, we find it worrying that Sky Light Holdings' P/S exceeds that of its industry peers. Apparently many investors in the company are way more bullish than recent times would indicate and aren't willing to let go of their stock at any price. Only the boldest would assume these prices are sustainable as a continuation of recent revenue trends is likely to weigh heavily on the share price eventually.
What Does Sky Light Holdings' P/S Mean For Investors?
A significant share price dive has done very little to deflate Sky Light Holdings' very lofty P/S. Typically, we'd caution against reading too much into price-to-sales ratios when settling on investment decisions, though it can reveal plenty about what other market participants think about the company.
We've established that Sky Light Holdings currently trades on a much higher than expected P/S since its recent revenues have been in decline over the medium-term. When we see revenue heading backwards and underperforming the industry forecasts, we feel the possibility of the share price declining is very real, bringing the P/S back into the realm of reasonability. If recent medium-term revenue trends continue, it will place shareholders' investments at significant risk and potential investors in danger of paying an excessive premium.
Many other vital risk factors can be found on the company's balance sheet. Our free balance sheet analysis for Sky Light Holdings with six simple checks will allow you to discover any risks that could be an issue.
Of course, profitable companies with a history of great earnings growth are generally safer bets. So you may wish to see this free collection of other companies that have reasonable P/E ratios and have grown earnings strongly.
New: Manage All Your Stock Portfolios in One Place
We've created the ultimate portfolio companion for stock investors, and it's free.
• Connect an unlimited number of Portfolios and see your total in one currency• Be alerted to new Warning Signs or Risks via email or mobile• Track the Fair Value of your stocks
Try a Demo Portfolio for FreeHave feedback on this article? Concerned about the content? Get in touch with us directly. Alternatively, email editorial-team (at) simplywallst.com.This article by Simply Wall St is general in nature. We provide commentary based on historical data and analyst forecasts only using an unbiased methodology and our articles are not intended to be financial advice. It does not constitute a recommendation to buy or sell any stock, and does not take account of your objectives, or your financial situation. We aim to bring you long-term focused analysis driven by fundamental data. Note that our analysis may not factor in the latest price-sensitive company announcements or qualitative material. Simply Wall St has no position in any stocks mentioned.
Disclaimer: Investing carries risk. This is not financial advice. The above content should not be regarded as an offer, recommendation, or solicitation on acquiring or disposing of any financial products, any associated discussions, comments, or posts by author or other users should not be considered as such either. It is solely for general information purpose only, which does not consider your own investment objectives, financial situations or needs. TTM assumes no responsibility or warranty for the accuracy and completeness of the information, investors should do their own research and may seek professional advice before investing.
Most Discussed
- 1
- 2
- 3
- 4
- 5
- 6
- 7
- 8
- 9
- 10