Are Investors Undervaluing Genertec Universal Medical Group Company Limited (HKG:2666) By 22%?
Key Insights
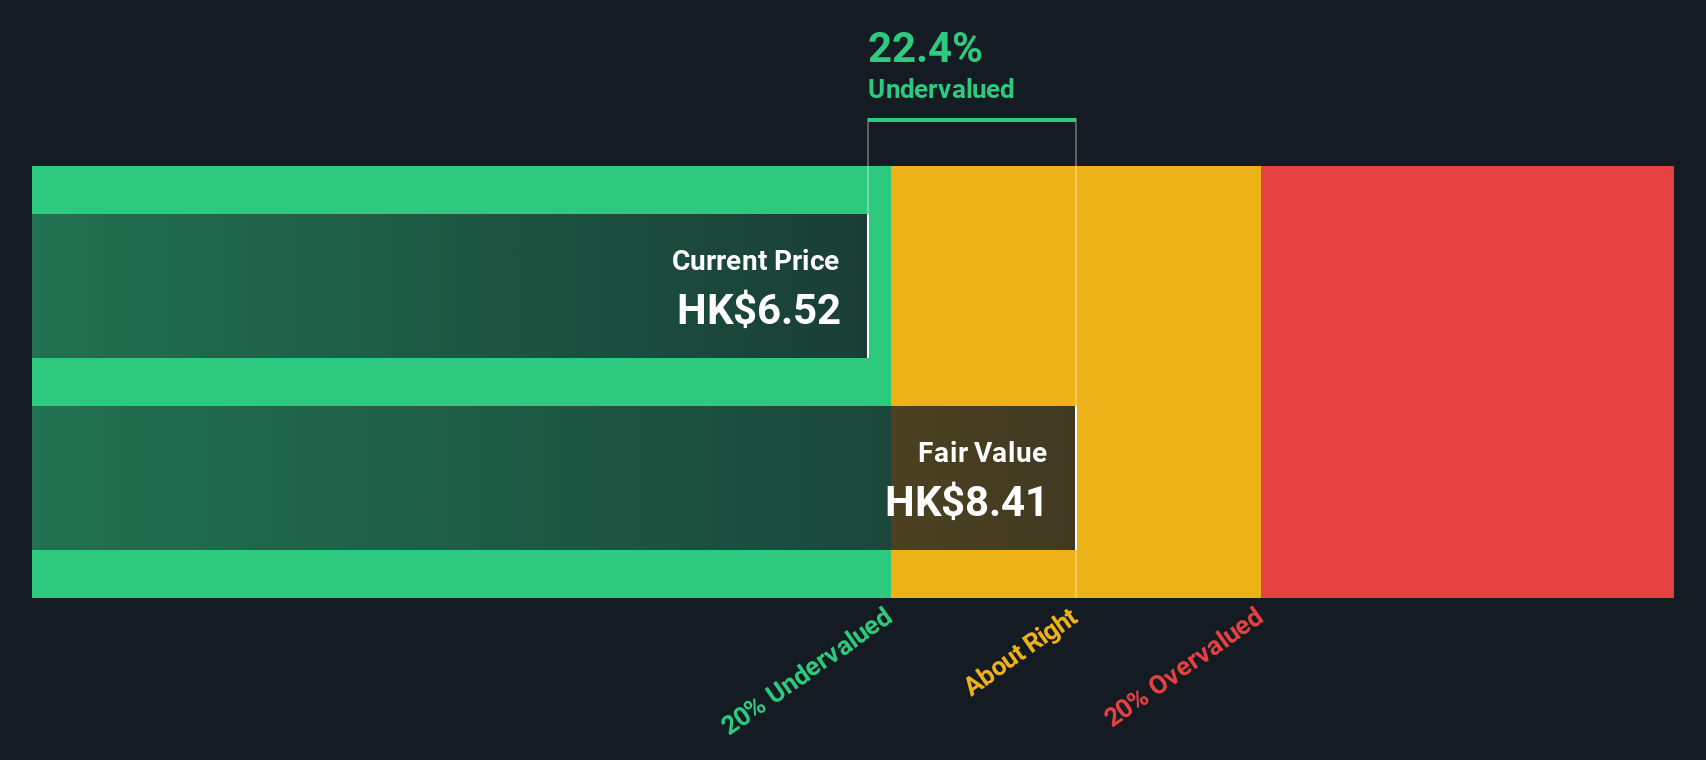
- The projected fair value for Genertec Universal Medical Group is HK$8.41 based on Dividend Discount Model
- Genertec Universal Medical Group's HK$6.52 share price signals that it might be 22% undervalued
- Analyst price target for 2666 is CN¥7.68 which is 8.6% below our fair value estimate
Today we'll do a simple run through of a valuation method used to estimate the attractiveness of Genertec Universal Medical Group Company Limited (HKG:2666) as an investment opportunity by taking the expected future cash flows and discounting them to today's value. This will be done using the Discounted Cash Flow (DCF) model. Don't get put off by the jargon, the math behind it is actually quite straightforward.
We would caution that there are many ways of valuing a company and, like the DCF, each technique has advantages and disadvantages in certain scenarios. Anyone interested in learning a bit more about intrinsic value should have a read of the Simply Wall St analysis model.
Trump has pledged to "unleash" American oil and gas and these 15 US stocks have developments that are poised to benefit.
Is Genertec Universal Medical Group Fairly Valued?
As Genertec Universal Medical Group operates in the healthcare sector, we need to calculate the intrinsic value slightly differently. In this approach dividends per share (DPS) are used, as free cash flow is difficult to estimate and often not reported by analysts. This often underestimates the value of a stock, but it can still be good as a comparison to competitors. The 'Gordon Growth Model' is used, which simply assumes that dividend payments will continue to increase at a sustainable growth rate forever. For a number of reasons a very conservative growth rate is used that cannot exceed that of a company's Gross Domestic Product (GDP). In this case we used the 5-year average of the 10-year government bond yield (2.6%). The expected dividend per share is then discounted to today's value at a cost of equity of 6.8%. Compared to the current share price of HK$6.5, the company appears a touch undervalued at a 22% discount to where the stock price trades currently. The assumptions in any calculation have a big impact on the valuation, so it is better to view this as a rough estimate, not precise down to the last cent.
Value Per Share = Expected Dividend Per Share / (Discount Rate - Perpetual Growth Rate)
= CN¥0.3 / (6.8% – 2.6%)
= HK$8.4
Important Assumptions
We would point out that the most important inputs to a discounted cash flow are the discount rate and of course the actual cash flows. If you don't agree with these result, have a go at the calculation yourself and play with the assumptions. The DCF also does not consider the possible cyclicality of an industry, or a company's future capital requirements, so it does not give a full picture of a company's potential performance. Given that we are looking at Genertec Universal Medical Group as potential shareholders, the cost of equity is used as the discount rate, rather than the cost of capital (or weighted average cost of capital, WACC) which accounts for debt. In this calculation we've used 6.8%, which is based on a levered beta of 0.800. Beta is a measure of a stock's volatility, compared to the market as a whole. We get our beta from the industry average beta of globally comparable companies, with an imposed limit between 0.8 and 2.0, which is a reasonable range for a stable business.
View our latest analysis for Genertec Universal Medical Group
SWOT Analysis for Genertec Universal Medical Group
- Earnings growth over the past year exceeded the industry.
- See 2666's revenue and earnings trends.
- Earnings growth over the past year is below its 5-year average.
- Dividend is low compared to the top 25% of dividend payers in the Healthcare market.
- Annual earnings are forecast to grow for the next 3 years.
- Good value based on P/E ratio and estimated fair value.
- Debt is not well covered by operating cash flow.
- Paying a dividend but company has no free cash flows.
- Annual earnings are forecast to grow slower than the Hong Kong market.
- Is 2666 well equipped to handle threats?
Next Steps:
Although the valuation of a company is important, it ideally won't be the sole piece of analysis you scrutinize for a company. The DCF model is not a perfect stock valuation tool. Preferably you'd apply different cases and assumptions and see how they would impact the company's valuation. If a company grows at a different rate, or if its cost of equity or risk free rate changes sharply, the output can look very different. Can we work out why the company is trading at a discount to intrinsic value? For Genertec Universal Medical Group, we've put together three relevant aspects you should look at:
- Risks: Case in point, we've spotted 2 warning signs for Genertec Universal Medical Group you should be aware of, and 1 of them shouldn't be ignored.
- Future Earnings: How does 2666's growth rate compare to its peers and the wider market? Dig deeper into the analyst consensus number for the upcoming years by interacting with our free analyst growth expectation chart.
- Other Solid Businesses: Low debt, high returns on equity and good past performance are fundamental to a strong business. Why not explore our interactive list of stocks with solid business fundamentals to see if there are other companies you may not have considered!
PS. Simply Wall St updates its DCF calculation for every Hong Kong stock every day, so if you want to find the intrinsic value of any other stock just search here.
New: Manage All Your Stock Portfolios in One Place
We've created the ultimate portfolio companion for stock investors, and it's free.
• Connect an unlimited number of Portfolios and see your total in one currency• Be alerted to new Warning Signs or Risks via email or mobile• Track the Fair Value of your stocks
Try a Demo Portfolio for FreeHave feedback on this article? Concerned about the content? Get in touch with us directly. Alternatively, email editorial-team (at) simplywallst.com.This article by Simply Wall St is general in nature. We provide commentary based on historical data and analyst forecasts only using an unbiased methodology and our articles are not intended to be financial advice. It does not constitute a recommendation to buy or sell any stock, and does not take account of your objectives, or your financial situation. We aim to bring you long-term focused analysis driven by fundamental data. Note that our analysis may not factor in the latest price-sensitive company announcements or qualitative material. Simply Wall St has no position in any stocks mentioned.
Disclaimer: Investing carries risk. This is not financial advice. The above content should not be regarded as an offer, recommendation, or solicitation on acquiring or disposing of any financial products, any associated discussions, comments, or posts by author or other users should not be considered as such either. It is solely for general information purpose only, which does not consider your own investment objectives, financial situations or needs. TTM assumes no responsibility or warranty for the accuracy and completeness of the information, investors should do their own research and may seek professional advice before investing.
Most Discussed
- 1
- 2
- 3
- 4
- 5
- 6
- 7
- 8
- 9
- 10