MACOM Technology Solutions Holdings, Inc.'s (NASDAQ:MTSI) Popularity With Investors Is Under Threat From Overpricing
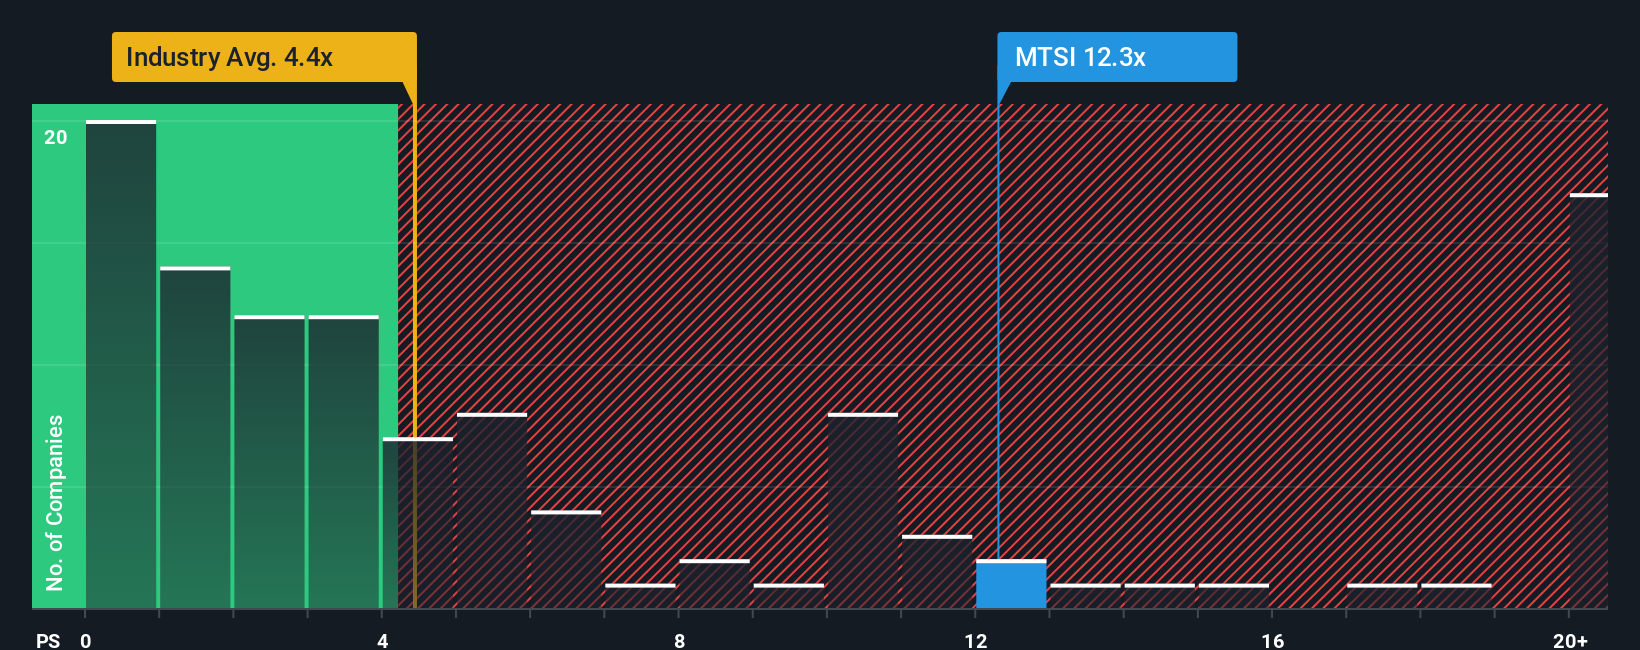
With a price-to-sales (or "P/S") ratio of 12.3x MACOM Technology Solutions Holdings, Inc. (NASDAQ:MTSI) may be sending very bearish signals at the moment, given that almost half of all the Semiconductor companies in the United States have P/S ratios under 4.4x and even P/S lower than 1.8x are not unusual. Although, it's not wise to just take the P/S at face value as there may be an explanation why it's so lofty.
Trump has pledged to "unleash" American oil and gas and these 15 US stocks have developments that are poised to benefit.
See our latest analysis for MACOM Technology Solutions Holdings
How MACOM Technology Solutions Holdings Has Been Performing
MACOM Technology Solutions Holdings could be doing better as it's been growing revenue less than most other companies lately. Perhaps the market is expecting future revenue performance to undergo a reversal of fortunes, which has elevated the P/S ratio. However, if this isn't the case, investors might get caught out paying too much for the stock.
Want the full picture on analyst estimates for the company? Then our free report on MACOM Technology Solutions Holdings will help you uncover what's on the horizon.What Are Revenue Growth Metrics Telling Us About The High P/S?
There's an inherent assumption that a company should far outperform the industry for P/S ratios like MACOM Technology Solutions Holdings' to be considered reasonable.
Retrospectively, the last year delivered an exceptional 32% gain to the company's top line. The strong recent performance means it was also able to grow revenue by 34% in total over the last three years. Accordingly, shareholders would have definitely welcomed those medium-term rates of revenue growth.
Looking ahead now, revenue is anticipated to climb by 12% each year during the coming three years according to the analysts following the company. With the industry predicted to deliver 22% growth each year, the company is positioned for a weaker revenue result.
With this in consideration, we believe it doesn't make sense that MACOM Technology Solutions Holdings' P/S is outpacing its industry peers. Apparently many investors in the company are way more bullish than analysts indicate and aren't willing to let go of their stock at any price. There's a good chance these shareholders are setting themselves up for future disappointment if the P/S falls to levels more in line with the growth outlook.
The Final Word
While the price-to-sales ratio shouldn't be the defining factor in whether you buy a stock or not, it's quite a capable barometer of revenue expectations.
It comes as a surprise to see MACOM Technology Solutions Holdings trade at such a high P/S given the revenue forecasts look less than stellar. Right now we aren't comfortable with the high P/S as the predicted future revenues aren't likely to support such positive sentiment for long. Unless these conditions improve markedly, it's very challenging to accept these prices as being reasonable.
Many other vital risk factors can be found on the company's balance sheet. You can assess many of the main risks through our free balance sheet analysis for MACOM Technology Solutions Holdings with six simple checks.
If you're unsure about the strength of MACOM Technology Solutions Holdings' business, why not explore our interactive list of stocks with solid business fundamentals for some other companies you may have missed.
New: Manage All Your Stock Portfolios in One Place
We've created the ultimate portfolio companion for stock investors, and it's free.
• Connect an unlimited number of Portfolios and see your total in one currency• Be alerted to new Warning Signs or Risks via email or mobile• Track the Fair Value of your stocks
Try a Demo Portfolio for FreeHave feedback on this article? Concerned about the content? Get in touch with us directly. Alternatively, email editorial-team (at) simplywallst.com.This article by Simply Wall St is general in nature. We provide commentary based on historical data and analyst forecasts only using an unbiased methodology and our articles are not intended to be financial advice. It does not constitute a recommendation to buy or sell any stock, and does not take account of your objectives, or your financial situation. We aim to bring you long-term focused analysis driven by fundamental data. Note that our analysis may not factor in the latest price-sensitive company announcements or qualitative material. Simply Wall St has no position in any stocks mentioned.
Disclaimer: Investing carries risk. This is not financial advice. The above content should not be regarded as an offer, recommendation, or solicitation on acquiring or disposing of any financial products, any associated discussions, comments, or posts by author or other users should not be considered as such either. It is solely for general information purpose only, which does not consider your own investment objectives, financial situations or needs. TTM assumes no responsibility or warranty for the accuracy and completeness of the information, investors should do their own research and may seek professional advice before investing.
Most Discussed
- 1
- 2
- 3
- 4
- 5
- 6
- 7
- 8
- 9
- 10