Sonic crypto price on edge as network its a 120m milestone
Sonic crypto price surged for the second consecutive day as the network’s transactions reached the 120 million milestone.
- Sonic price is on edge as its transactions hit the 120 million milestone.
- The stablecoin supply has plunged in the past few months.
- Its total value locked in the DeFi industry has also crashed.
Sonic (S) token soared to a high of $0.3555 on Thursday, up 25% from its lowest point this week. It then pared some of those gains and was trading at $0.3300 at press time.
Sonic transactions hit 120m
Sonic jumped after the developers announced that the layer-1 network crossed 120 million transactions, just six months after its launch.
While this is a notable milestone, there are signs that Sonic is losing momentum, which likely explains why its token pulled back after the initial surge.
Nansen data shows that Sonic’s transactions plunged 202% to 8.6 million in the last 30 days. At the same time, the number of active addresses on the network dropped 40% to 232,000. This slowdown occurred even as other chains like Arbitrum and Linea saw a surge in transactions.
More data shows that the Sonic ecosystem is struggling. According to DeFi Llama, the amount of stablecoin in its ecosystem fell to $209 million, the lowest level since March and well below the year-to-date high of $597 million.
Sonic’s total value locked has also been in a strong downtrend in recent months. After peaking at nearly $2 billion earlier this year, TVL has plunged to $1.2 billion.
Sonic price technical analysis

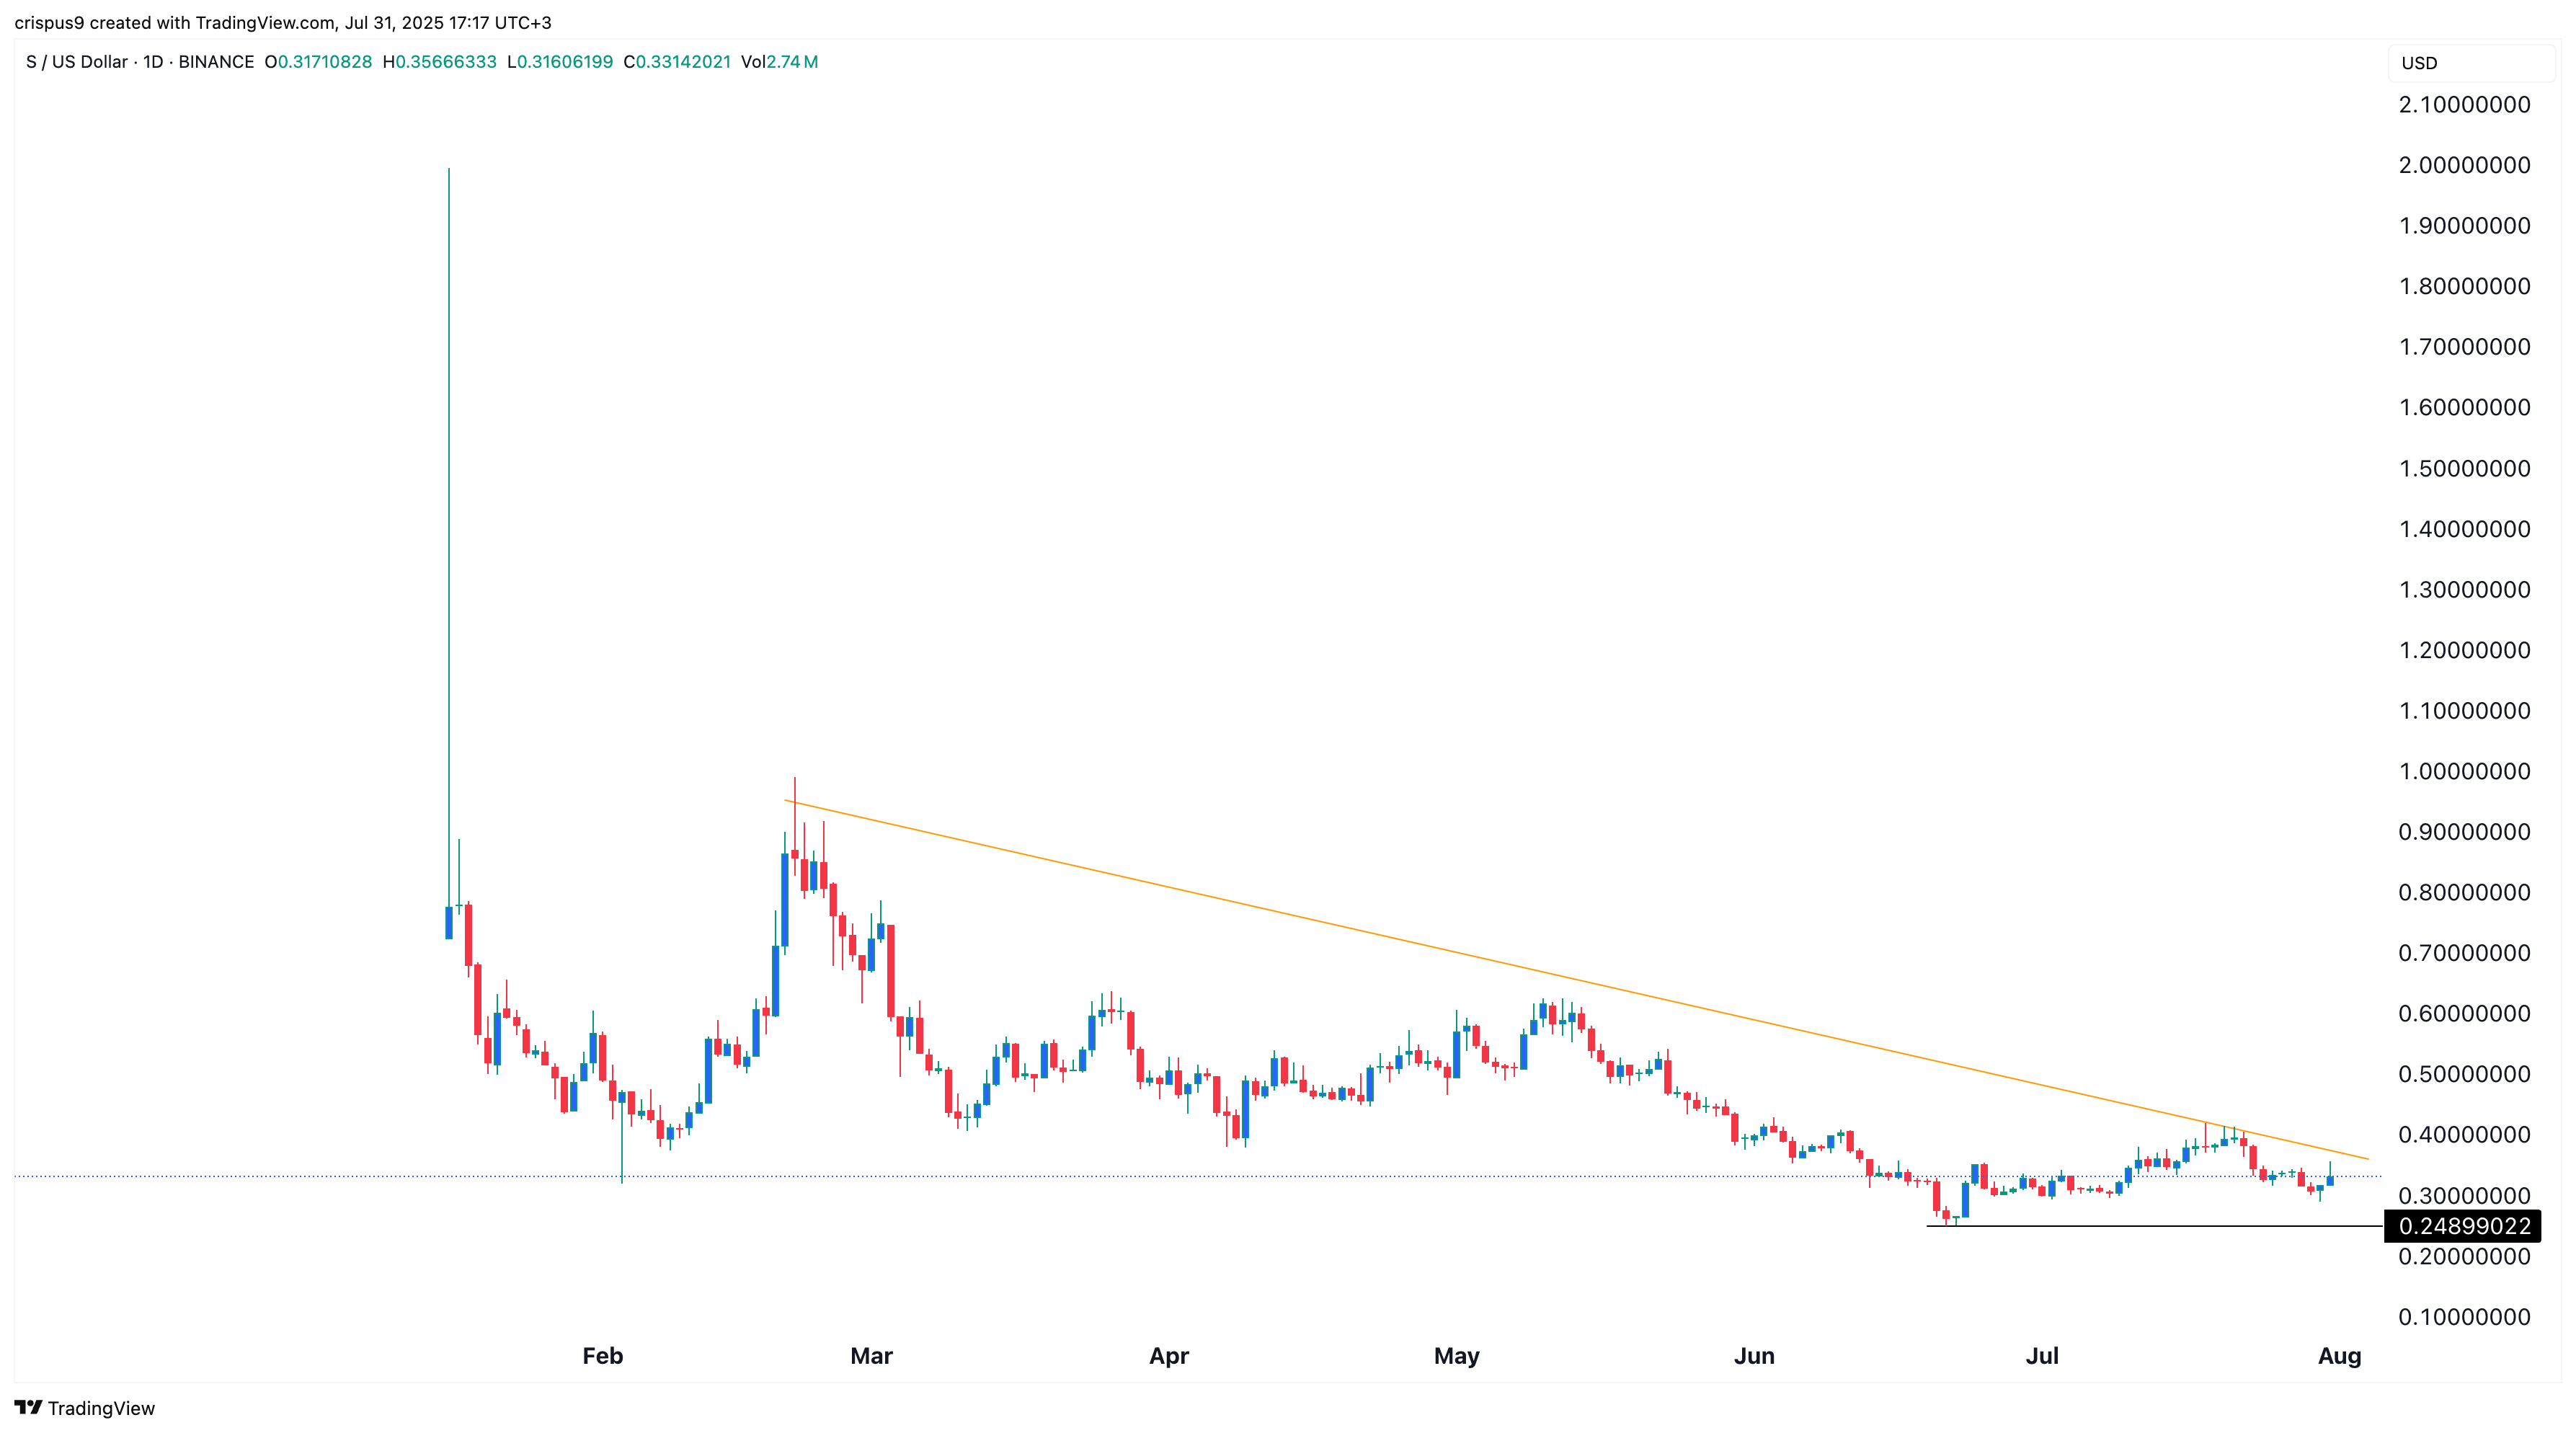
The daily chart shows that the Sonic crypto price has traded sideways in recent days. It was trading at $0.30, a few points above the year-to-date low of $0.2490.
The token has formed a descending triangle pattern, a popular bearish continuation signal. With transactions, DeFi assets, and stablecoin supply falling, there is a risk of a bearish breakdown. If this occurs, the initial target will be the all-time low of $0.2490. A move below that level would signal further downside.
On the flip side, a move above the upper side of the descending channel would confirm a bullish breakout and point to more gains.
Disclaimer: Investing carries risk. This is not financial advice. The above content should not be regarded as an offer, recommendation, or solicitation on acquiring or disposing of any financial products, any associated discussions, comments, or posts by author or other users should not be considered as such either. It is solely for general information purpose only, which does not consider your own investment objectives, financial situations or needs. TTM assumes no responsibility or warranty for the accuracy and completeness of the information, investors should do their own research and may seek professional advice before investing.
Most Discussed
- 1
- 2
- 3
- 4
- 5
- 6
- 7
- 8
- 9
- 10