Does AnAn International (SGX:Y35) Have A Healthy Balance Sheet?
Howard Marks put it nicely when he said that, rather than worrying about share price volatility, 'The possibility of permanent loss is the risk I worry about... and every practical investor I know worries about.' It's only natural to consider a company's balance sheet when you examine how risky it is, since debt is often involved when a business collapses. As with many other companies AnAn International Limited (SGX:Y35) makes use of debt. But the real question is whether this debt is making the company risky.
This technology could replace computers: discover the 20 stocks are working to make quantum computing a reality.
When Is Debt A Problem?
Debt assists a business until the business has trouble paying it off, either with new capital or with free cash flow. In the worst case scenario, a company can go bankrupt if it cannot pay its creditors. However, a more frequent (but still costly) occurrence is where a company must issue shares at bargain-basement prices, permanently diluting shareholders, just to shore up its balance sheet. Of course, debt can be an important tool in businesses, particularly capital heavy businesses. When we examine debt levels, we first consider both cash and debt levels, together.
How Much Debt Does AnAn International Carry?
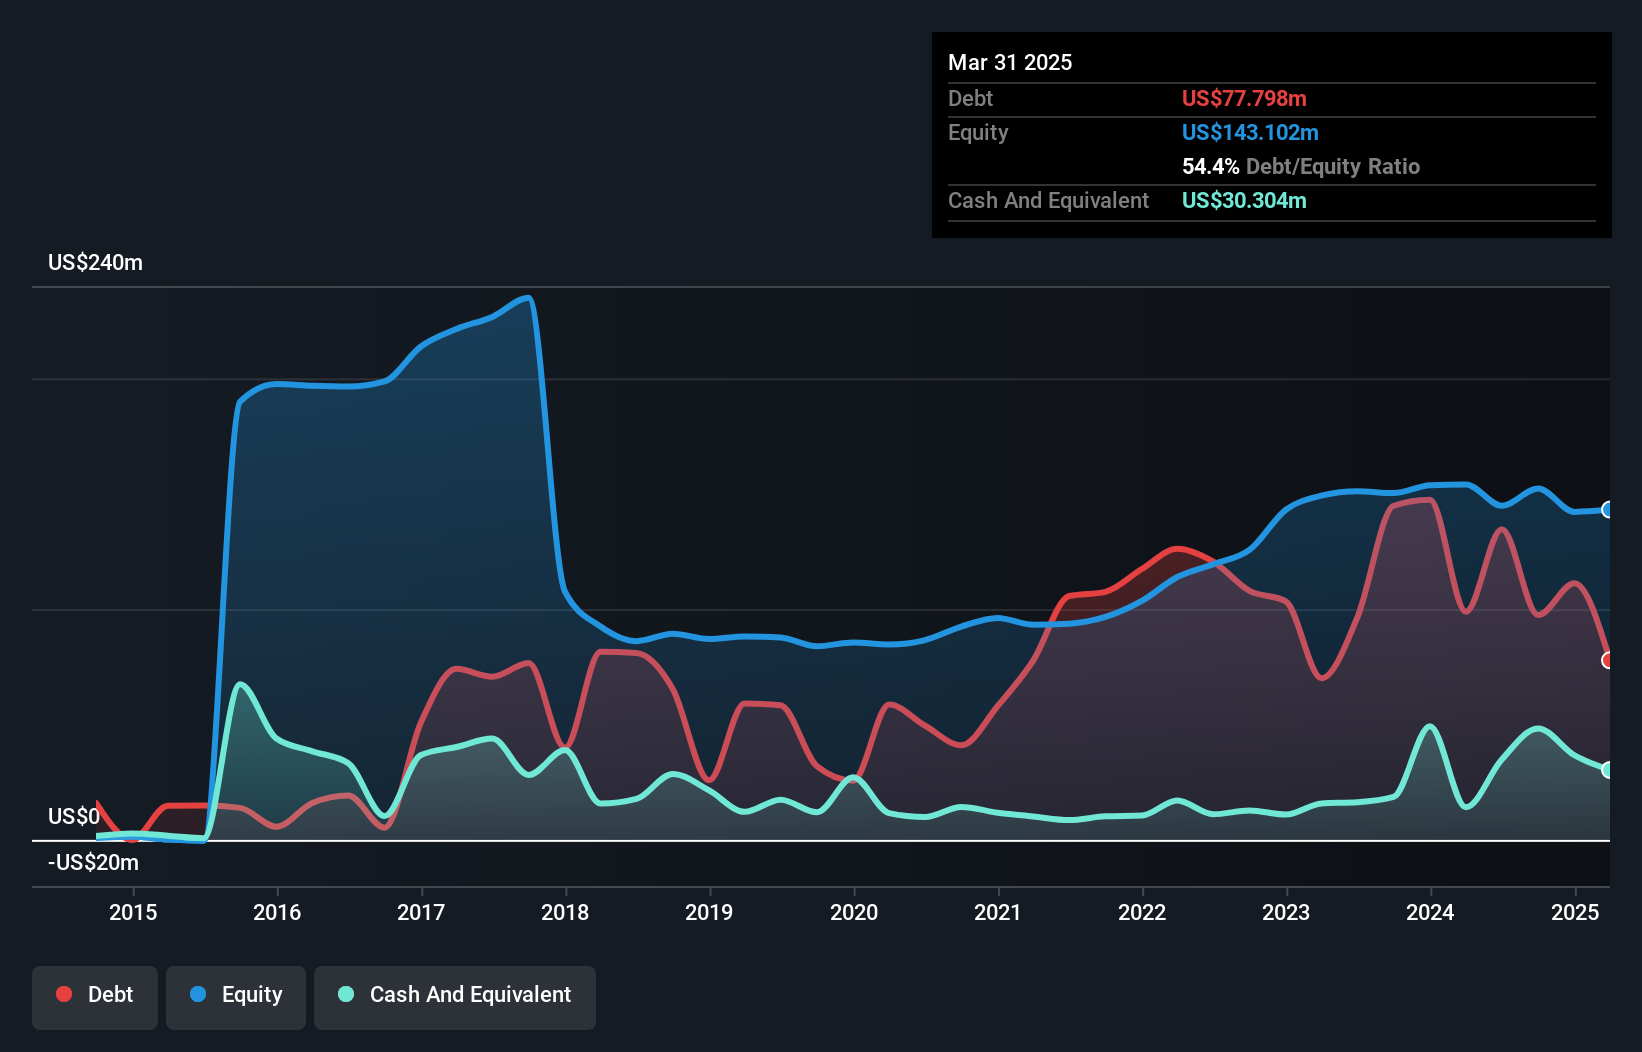
The image below, which you can click on for greater detail, shows that AnAn International had debt of US$77.8m at the end of March 2025, a reduction from US$98.9m over a year. On the flip side, it has US$30.3m in cash leading to net debt of about US$47.5m.
How Healthy Is AnAn International's Balance Sheet?
The latest balance sheet data shows that AnAn International had liabilities of US$280.9m due within a year, and liabilities of US$40.8m falling due after that. Offsetting this, it had US$30.3m in cash and US$193.7m in receivables that were due within 12 months. So its liabilities outweigh the sum of its cash and (near-term) receivables by US$97.6m.
This deficit casts a shadow over the US$19.6m company, like a colossus towering over mere mortals. So we definitely think shareholders need to watch this one closely. After all, AnAn International would likely require a major re-capitalisation if it had to pay its creditors today. The balance sheet is clearly the area to focus on when you are analysing debt. But you can't view debt in total isolation; since AnAn International will need earnings to service that debt. So when considering debt, it's definitely worth looking at the earnings trend. Click here for an interactive snapshot.
View our latest analysis for AnAn International
In the last year AnAn International's revenue was pretty flat, and it made a negative EBIT. While that hardly impresses, its not too bad either.
Caveat Emptor
Over the last twelve months AnAn International produced an earnings before interest and tax (EBIT) loss. To be specific the EBIT loss came in at US$1.2m. Combining this information with the significant liabilities we already touched on makes us very hesitant about this stock, to say the least. Of course, it may be able to improve its situation with a bit of luck and good execution. But we think that is unlikely since it is low on liquid assets, and made a loss of US$212k in the last year. So while it's not wise to assume the company will fail, we do think it's risky. When analysing debt levels, the balance sheet is the obvious place to start. But ultimately, every company can contain risks that exist outside of the balance sheet. For example - AnAn International has 1 warning sign we think you should be aware of.
If, after all that, you're more interested in a fast growing company with a rock-solid balance sheet, then check out our list of net cash growth stocks without delay.
New: Manage All Your Stock Portfolios in One Place
We've created the ultimate portfolio companion for stock investors, and it's free.
• Connect an unlimited number of Portfolios and see your total in one currency• Be alerted to new Warning Signs or Risks via email or mobile• Track the Fair Value of your stocks
Try a Demo Portfolio for FreeHave feedback on this article? Concerned about the content? Get in touch with us directly. Alternatively, email editorial-team (at) simplywallst.com.This article by Simply Wall St is general in nature. We provide commentary based on historical data and analyst forecasts only using an unbiased methodology and our articles are not intended to be financial advice. It does not constitute a recommendation to buy or sell any stock, and does not take account of your objectives, or your financial situation. We aim to bring you long-term focused analysis driven by fundamental data. Note that our analysis may not factor in the latest price-sensitive company announcements or qualitative material. Simply Wall St has no position in any stocks mentioned.
Disclaimer: Investing carries risk. This is not financial advice. The above content should not be regarded as an offer, recommendation, or solicitation on acquiring or disposing of any financial products, any associated discussions, comments, or posts by author or other users should not be considered as such either. It is solely for general information purpose only, which does not consider your own investment objectives, financial situations or needs. TTM assumes no responsibility or warranty for the accuracy and completeness of the information, investors should do their own research and may seek professional advice before investing.
Most Discussed
- 1
- 2
- 3
- 4
- 5
- 6
- 7
- 8
- 9
- 10