Maxeon Solar Technologies, Ltd.'s (NASDAQ:MAXN) Price Is Right But Growth Is Lacking After Shares Rocket 42%
Maxeon Solar Technologies, Ltd. (NASDAQ:MAXN) shareholders have had their patience rewarded with a 42% share price jump in the last month. Still, the 30-day jump doesn't change the fact that longer term shareholders have seen their stock decimated by the 76% share price drop in the last twelve months.
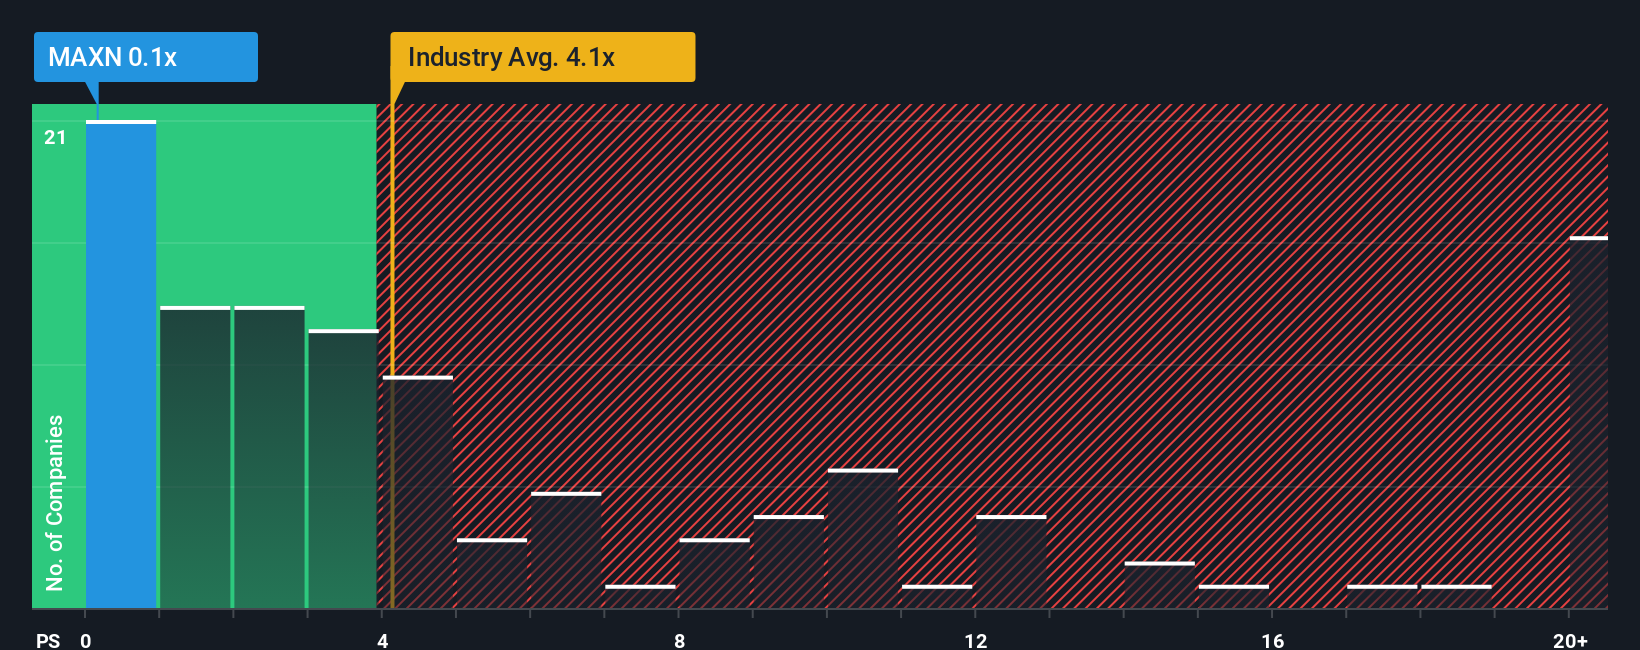
In spite of the firm bounce in price, Maxeon Solar Technologies' price-to-sales (or "P/S") ratio of 0.1x might still make it look like a strong buy right now compared to the wider Semiconductor industry in the United States, where around half of the companies have P/S ratios above 4.1x and even P/S above 11x are quite common. Nonetheless, we'd need to dig a little deeper to determine if there is a rational basis for the highly reduced P/S.
We've found 21 US stocks that are forecast to pay a dividend yield of over 6% next year. See the full list for free.
Check out our latest analysis for Maxeon Solar Technologies
What Does Maxeon Solar Technologies' P/S Mean For Shareholders?
For example, consider that Maxeon Solar Technologies' financial performance has been poor lately as its revenue has been in decline. Perhaps the market believes the recent revenue performance isn't good enough to keep up the industry, causing the P/S ratio to suffer. However, if this doesn't eventuate then existing shareholders may be feeling optimistic about the future direction of the share price.
Although there are no analyst estimates available for Maxeon Solar Technologies, take a look at this free data-rich visualisation to see how the company stacks up on earnings, revenue and cash flow.How Is Maxeon Solar Technologies' Revenue Growth Trending?
There's an inherent assumption that a company should far underperform the industry for P/S ratios like Maxeon Solar Technologies' to be considered reasonable.
Taking a look back first, the company's revenue growth last year wasn't something to get excited about as it posted a disappointing decline of 55%. This means it has also seen a slide in revenue over the longer-term as revenue is down 35% in total over the last three years. Therefore, it's fair to say the revenue growth recently has been undesirable for the company.
Weighing that medium-term revenue trajectory against the broader industry's one-year forecast for expansion of 32% shows it's an unpleasant look.
In light of this, it's understandable that Maxeon Solar Technologies' P/S would sit below the majority of other companies. Nonetheless, there's no guarantee the P/S has reached a floor yet with revenue going in reverse. Even just maintaining these prices could be difficult to achieve as recent revenue trends are already weighing down the shares.
What Does Maxeon Solar Technologies' P/S Mean For Investors?
Even after such a strong price move, Maxeon Solar Technologies' P/S still trails the rest of the industry. Using the price-to-sales ratio alone to determine if you should sell your stock isn't sensible, however it can be a practical guide to the company's future prospects.
Our examination of Maxeon Solar Technologies confirms that the company's shrinking revenue over the past medium-term is a key factor in its low price-to-sales ratio, given the industry is projected to grow. At this stage investors feel the potential for an improvement in revenue isn't great enough to justify a higher P/S ratio. Given the current circumstances, it seems unlikely that the share price will experience any significant movement in either direction in the near future if recent medium-term revenue trends persist.
It is also worth noting that we have found 6 warning signs for Maxeon Solar Technologies (4 are potentially serious!) that you need to take into consideration.
It's important to make sure you look for a great company, not just the first idea you come across. So if growing profitability aligns with your idea of a great company, take a peek at this free list of interesting companies with strong recent earnings growth (and a low P/E).
New: Manage All Your Stock Portfolios in One Place
We've created the ultimate portfolio companion for stock investors, and it's free.
• Connect an unlimited number of Portfolios and see your total in one currency• Be alerted to new Warning Signs or Risks via email or mobile• Track the Fair Value of your stocks
Try a Demo Portfolio for FreeHave feedback on this article? Concerned about the content? Get in touch with us directly. Alternatively, email editorial-team (at) simplywallst.com.This article by Simply Wall St is general in nature. We provide commentary based on historical data and analyst forecasts only using an unbiased methodology and our articles are not intended to be financial advice. It does not constitute a recommendation to buy or sell any stock, and does not take account of your objectives, or your financial situation. We aim to bring you long-term focused analysis driven by fundamental data. Note that our analysis may not factor in the latest price-sensitive company announcements or qualitative material. Simply Wall St has no position in any stocks mentioned.
Disclaimer: Investing carries risk. This is not financial advice. The above content should not be regarded as an offer, recommendation, or solicitation on acquiring or disposing of any financial products, any associated discussions, comments, or posts by author or other users should not be considered as such either. It is solely for general information purpose only, which does not consider your own investment objectives, financial situations or needs. TTM assumes no responsibility or warranty for the accuracy and completeness of the information, investors should do their own research and may seek professional advice before investing.
Most Discussed
- 1
- 2
- 3
- 4
- 5
- 6
- 7
- 8
- 9
- 10