Here's Why We're Not Too Worried About Neonode's (NASDAQ:NEON) Cash Burn Situation
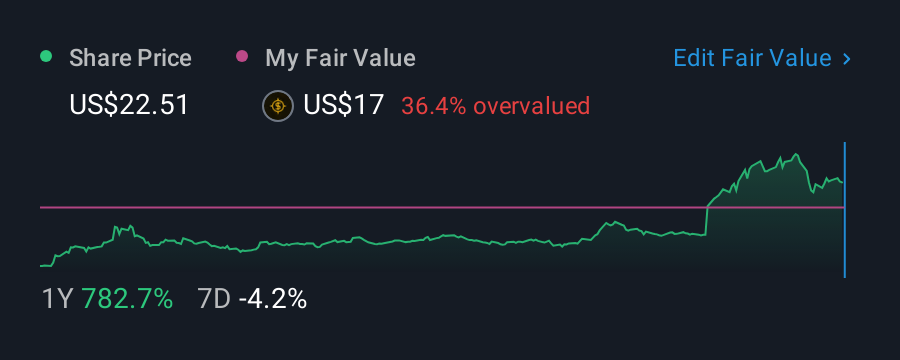
There's no doubt that money can be made by owning shares of unprofitable businesses. Indeed, Neonode (NASDAQ:NEON) stock is up 778% in the last year, providing strong gains for shareholders. Having said that, unprofitable companies are risky because they could potentially burn through all their cash and become distressed.
Given its strong share price performance, we think it's worthwhile for Neonode shareholders to consider whether its cash burn is concerning. In this article, we define cash burn as its annual (negative) free cash flow, which is the amount of money a company spends each year to fund its growth. The first step is to compare its cash burn with its cash reserves, to give us its 'cash runway'.
We've found 21 US stocks that are forecast to pay a dividend yield of over 6% next year. See the full list for free.
How Long Is Neonode's Cash Runway?
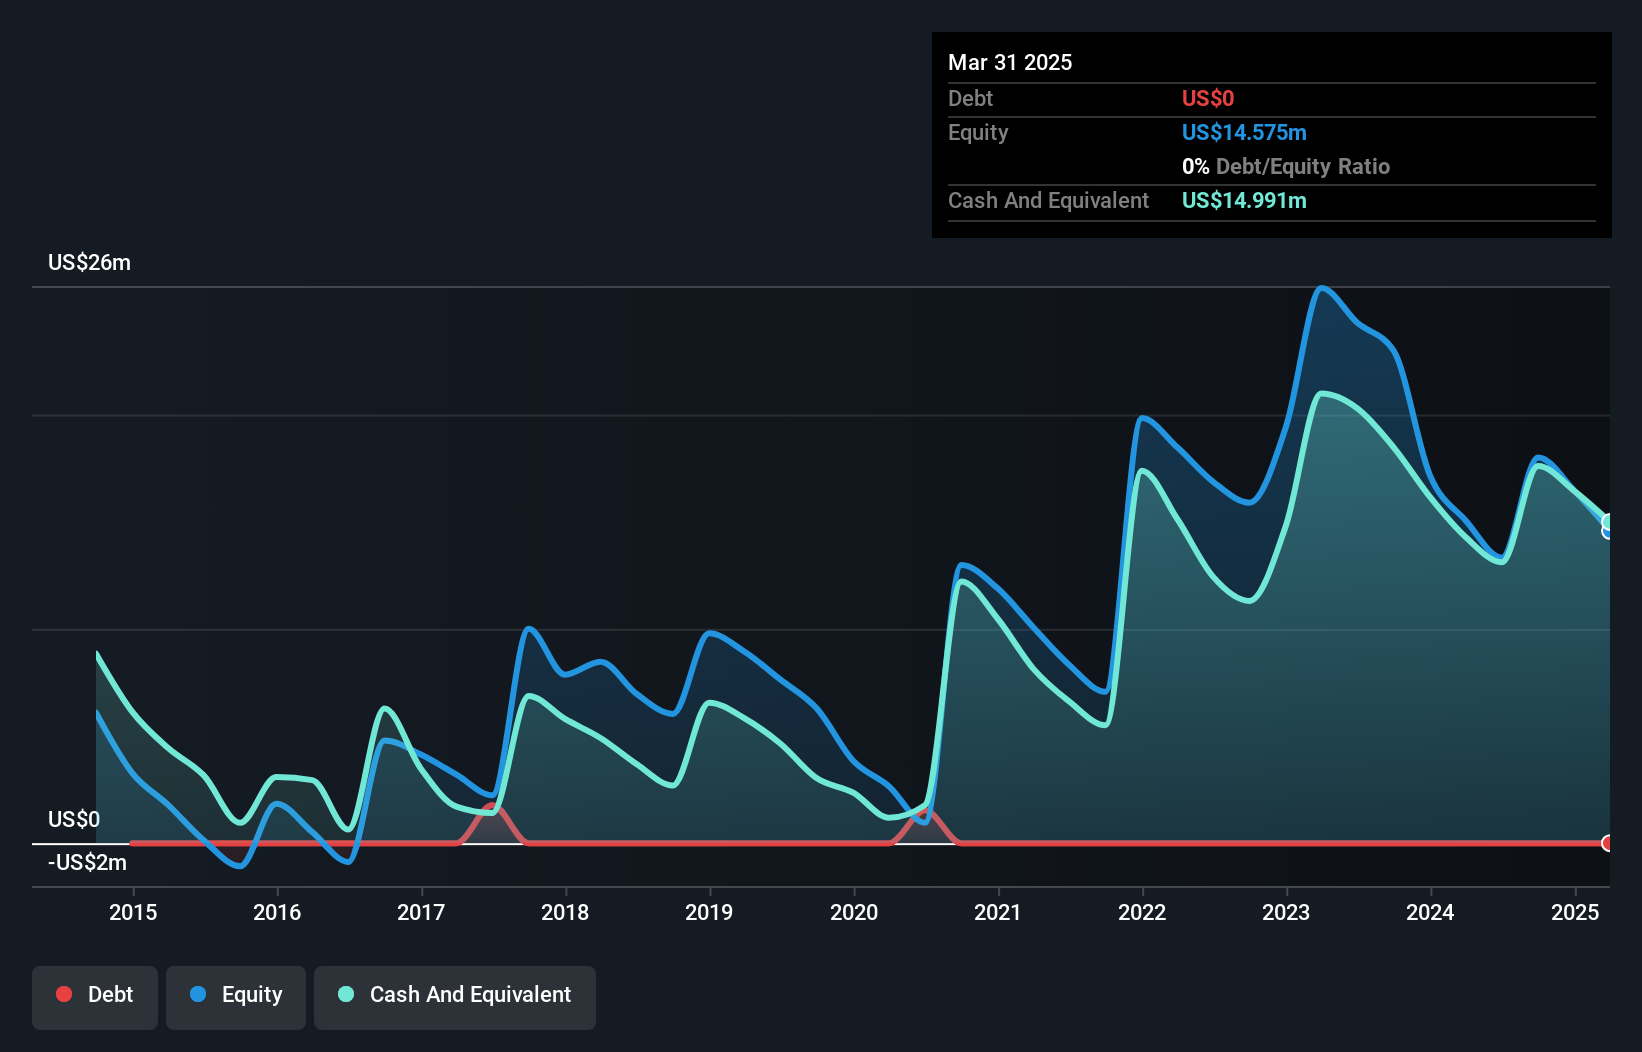
A company's cash runway is calculated by dividing its cash hoard by its cash burn. When Neonode last reported its March 2025 balance sheet in May 2025, it had zero debt and cash worth US$15m. In the last year, its cash burn was US$5.1m. That means it had a cash runway of about 2.9 years as of March 2025. Arguably, that's a prudent and sensible length of runway to have. The image below shows how its cash balance has been changing over the last few years.
See our latest analysis for Neonode
How Well Is Neonode Growing?
It was fairly positive to see that Neonode reduced its cash burn by 23% during the last year. But the revenue dip of 17% in the same period was a bit concerning. In light of the data above, we're fairly sanguine about the business growth trajectory. While the past is always worth studying, it is the future that matters most of all. For that reason, it makes a lot of sense to take a look at our analyst forecasts for the company.
How Hard Would It Be For Neonode To Raise More Cash For Growth?
There's no doubt Neonode seems to be in a fairly good position, when it comes to managing its cash burn, but even if it's only hypothetical, it's always worth asking how easily it could raise more money to fund growth. Issuing new shares, or taking on debt, are the most common ways for a listed company to raise more money for its business. One of the main advantages held by publicly listed companies is that they can sell shares to investors to raise cash and fund growth. By looking at a company's cash burn relative to its market capitalisation, we gain insight on how much shareholders would be diluted if the company needed to raise enough cash to cover another year's cash burn.
Neonode's cash burn of US$5.1m is about 1.3% of its US$394m market capitalisation. That means it could easily issue a few shares to fund more growth, and might well be in a position to borrow cheaply.
So, Should We Worry About Neonode's Cash Burn?
It may already be apparent to you that we're relatively comfortable with the way Neonode is burning through its cash. For example, we think its cash runway suggests that the company is on a good path. Although its falling revenue does give us reason for pause, the other metrics we discussed in this article form a positive picture overall. Looking at all the measures in this article, together, we're not worried about its rate of cash burn; the company seems well on top of its medium-term spending needs. Separately, we looked at different risks affecting the company and spotted 2 warning signs for Neonode (of which 1 shouldn't be ignored!) you should know about.
Of course, you might find a fantastic investment by looking elsewhere. So take a peek at this free list of interesting companies, and this list of stocks growth stocks (according to analyst forecasts)
Valuation is complex, but we're here to simplify it.
Discover if Neonode might be undervalued or overvalued with our detailed analysis, featuring fair value estimates, potential risks, dividends, insider trades, and its financial condition.
Access Free AnalysisHave feedback on this article? Concerned about the content? Get in touch with us directly. Alternatively, email editorial-team (at) simplywallst.com.This article by Simply Wall St is general in nature. We provide commentary based on historical data and analyst forecasts only using an unbiased methodology and our articles are not intended to be financial advice. It does not constitute a recommendation to buy or sell any stock, and does not take account of your objectives, or your financial situation. We aim to bring you long-term focused analysis driven by fundamental data. Note that our analysis may not factor in the latest price-sensitive company announcements or qualitative material. Simply Wall St has no position in any stocks mentioned.
Disclaimer: Investing carries risk. This is not financial advice. The above content should not be regarded as an offer, recommendation, or solicitation on acquiring or disposing of any financial products, any associated discussions, comments, or posts by author or other users should not be considered as such either. It is solely for general information purpose only, which does not consider your own investment objectives, financial situations or needs. TTM assumes no responsibility or warranty for the accuracy and completeness of the information, investors should do their own research and may seek professional advice before investing.
Most Discussed
- 1
- 2
- 3
- 4
- 5
- 6
- 7
- 8
- 9
- 10