Does Wharf Real Estate Investment (HKG:1997) Have A Healthy Balance Sheet?
The external fund manager backed by Berkshire Hathaway's Charlie Munger, Li Lu, makes no bones about it when he says 'The biggest investment risk is not the volatility of prices, but whether you will suffer a permanent loss of capital.' So it might be obvious that you need to consider debt, when you think about how risky any given stock is, because too much debt can sink a company. As with many other companies Wharf Real Estate Investment Company Limited (HKG:1997) makes use of debt. But is this debt a concern to shareholders?
This technology could replace computers: discover the 20 stocks are working to make quantum computing a reality.
Why Does Debt Bring Risk?
Debt and other liabilities become risky for a business when it cannot easily fulfill those obligations, either with free cash flow or by raising capital at an attractive price. Part and parcel of capitalism is the process of 'creative destruction' where failed businesses are mercilessly liquidated by their bankers. However, a more common (but still painful) scenario is that it has to raise new equity capital at a low price, thus permanently diluting shareholders. Of course, plenty of companies use debt to fund growth, without any negative consequences. The first step when considering a company's debt levels is to consider its cash and debt together.
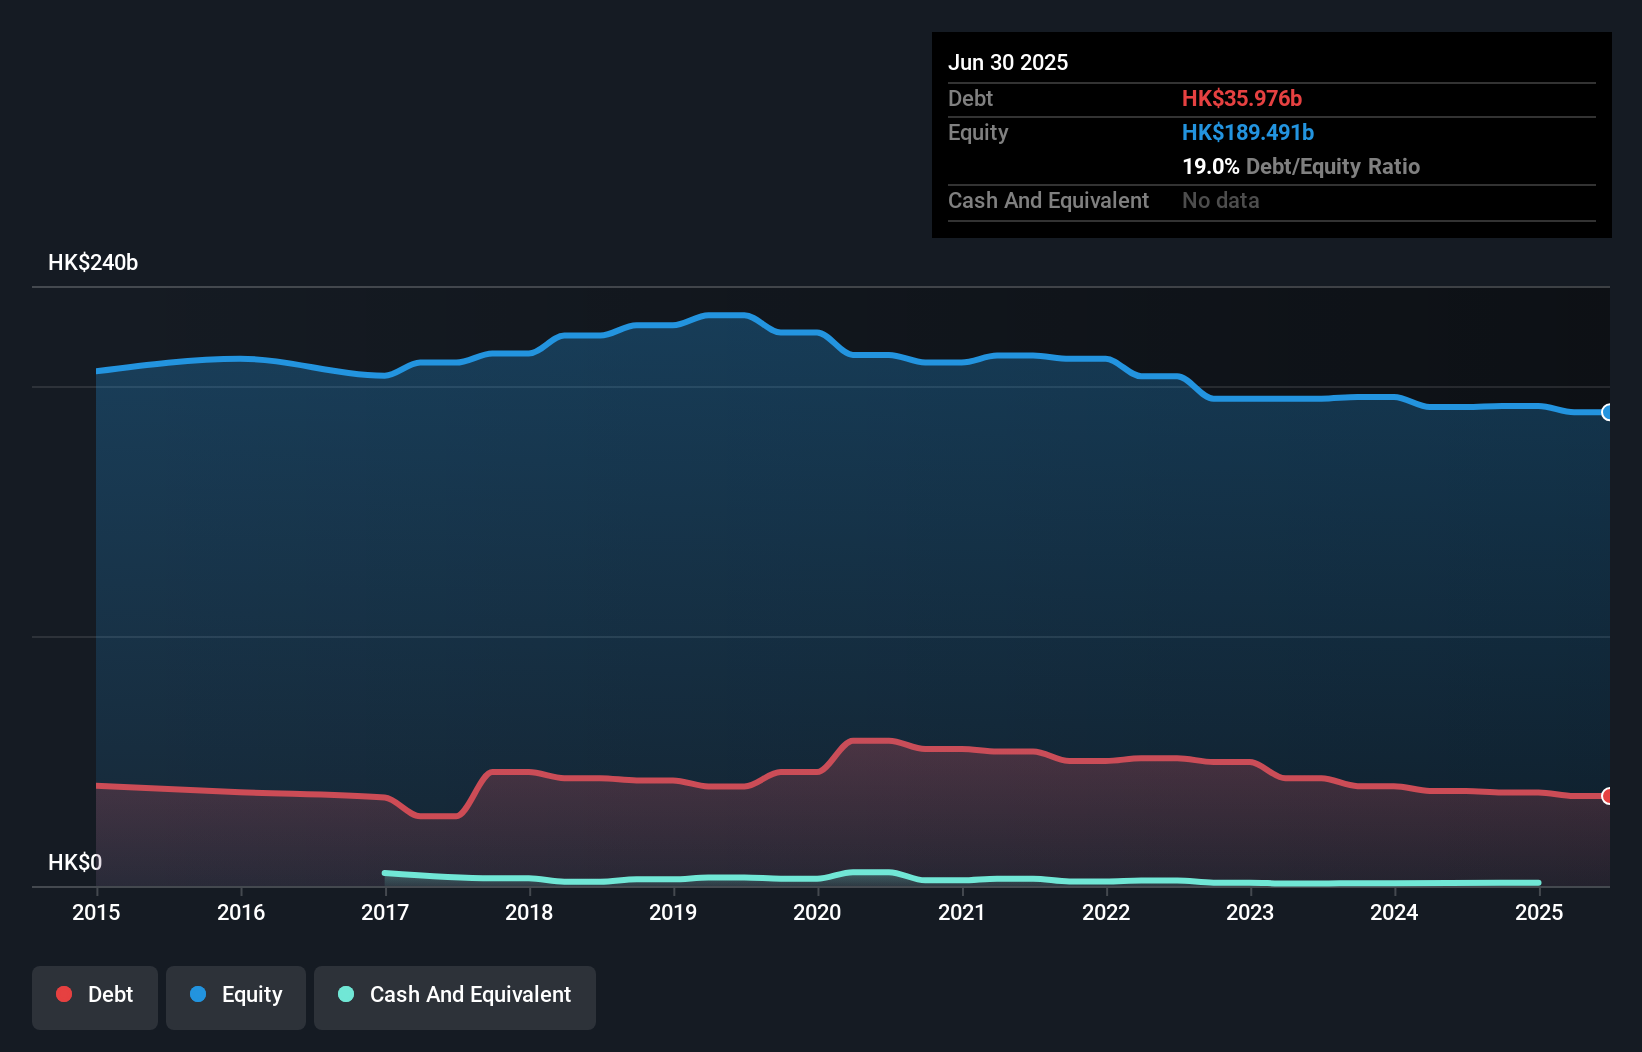
What Is Wharf Real Estate Investment's Debt?
You can click the graphic below for the historical numbers, but it shows that Wharf Real Estate Investment had HK$36.0b of debt in June 2025, down from HK$38.1b, one year before. On the flip side, it has HK$1.31b in cash leading to net debt of about HK$34.7b.
How Strong Is Wharf Real Estate Investment's Balance Sheet?
According to the last reported balance sheet, Wharf Real Estate Investment had liabilities of HK$14.9b due within 12 months, and liabilities of HK$29.8b due beyond 12 months. Offsetting this, it had HK$1.31b in cash and HK$885.0m in receivables that were due within 12 months. So its liabilities total HK$42.5b more than the combination of its cash and short-term receivables.
This deficit isn't so bad because Wharf Real Estate Investment is worth HK$71.7b, and thus could probably raise enough capital to shore up its balance sheet, if the need arose. But we definitely want to keep our eyes open to indications that its debt is bringing too much risk.
View our latest analysis for Wharf Real Estate Investment
We use two main ratios to inform us about debt levels relative to earnings. The first is net debt divided by earnings before interest, tax, depreciation, and amortization (EBITDA), while the second is how many times its earnings before interest and tax (EBIT) covers its interest expense (or its interest cover, for short). Thus we consider debt relative to earnings both with and without depreciation and amortization expenses.
Wharf Real Estate Investment has a debt to EBITDA ratio of 3.6 and its EBIT covered its interest expense 5.6 times. Taken together this implies that, while we wouldn't want to see debt levels rise, we think it can handle its current leverage. Unfortunately, Wharf Real Estate Investment saw its EBIT slide 5.1% in the last twelve months. If earnings continue on that decline then managing that debt will be difficult like delivering hot soup on a unicycle. There's no doubt that we learn most about debt from the balance sheet. But it is future earnings, more than anything, that will determine Wharf Real Estate Investment's ability to maintain a healthy balance sheet going forward. So if you're focused on the future you can check out this free report showing analyst profit forecasts.
Finally, a business needs free cash flow to pay off debt; accounting profits just don't cut it. So the logical step is to look at the proportion of that EBIT that is matched by actual free cash flow. Over the most recent three years, Wharf Real Estate Investment recorded free cash flow worth 65% of its EBIT, which is around normal, given free cash flow excludes interest and tax. This cold hard cash means it can reduce its debt when it wants to.
Our View
Wharf Real Estate Investment's net debt to EBITDA and EBIT growth rate definitely weigh on it, in our esteem. But we do take some comfort from its conversion of EBIT to free cash flow. We think that Wharf Real Estate Investment's debt does make it a bit risky, after considering the aforementioned data points together. Not all risk is bad, as it can boost share price returns if it pays off, but this debt risk is worth keeping in mind. There's no doubt that we learn most about debt from the balance sheet. But ultimately, every company can contain risks that exist outside of the balance sheet. For example - Wharf Real Estate Investment has 1 warning sign we think you should be aware of.
Of course, if you're the type of investor who prefers buying stocks without the burden of debt, then don't hesitate to discover our exclusive list of net cash growth stocks, today.
Valuation is complex, but we're here to simplify it.
Discover if Wharf Real Estate Investment might be undervalued or overvalued with our detailed analysis, featuring fair value estimates, potential risks, dividends, insider trades, and its financial condition.
Access Free AnalysisHave feedback on this article? Concerned about the content? Get in touch with us directly. Alternatively, email editorial-team (at) simplywallst.com.This article by Simply Wall St is general in nature. We provide commentary based on historical data and analyst forecasts only using an unbiased methodology and our articles are not intended to be financial advice. It does not constitute a recommendation to buy or sell any stock, and does not take account of your objectives, or your financial situation. We aim to bring you long-term focused analysis driven by fundamental data. Note that our analysis may not factor in the latest price-sensitive company announcements or qualitative material. Simply Wall St has no position in any stocks mentioned.
Disclaimer: Investing carries risk. This is not financial advice. The above content should not be regarded as an offer, recommendation, or solicitation on acquiring or disposing of any financial products, any associated discussions, comments, or posts by author or other users should not be considered as such either. It is solely for general information purpose only, which does not consider your own investment objectives, financial situations or needs. TTM assumes no responsibility or warranty for the accuracy and completeness of the information, investors should do their own research and may seek professional advice before investing.
Most Discussed
- 1
- 2
- 3
- 4
- 5
- 6
- 7
- 8
- 9
- 10