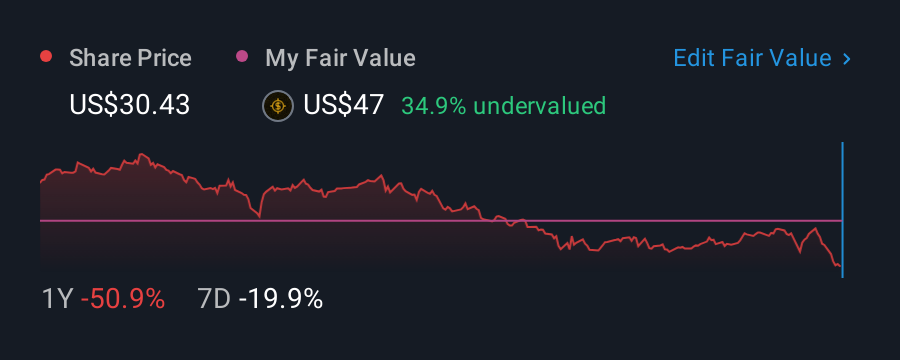
The Bruker Corporation (NASDAQ:BRKR) share price has fared very poorly over the last month, falling by a substantial 31%. The recent drop completes a disastrous twelve months for shareholders, who are sitting on a 51% loss during that time.
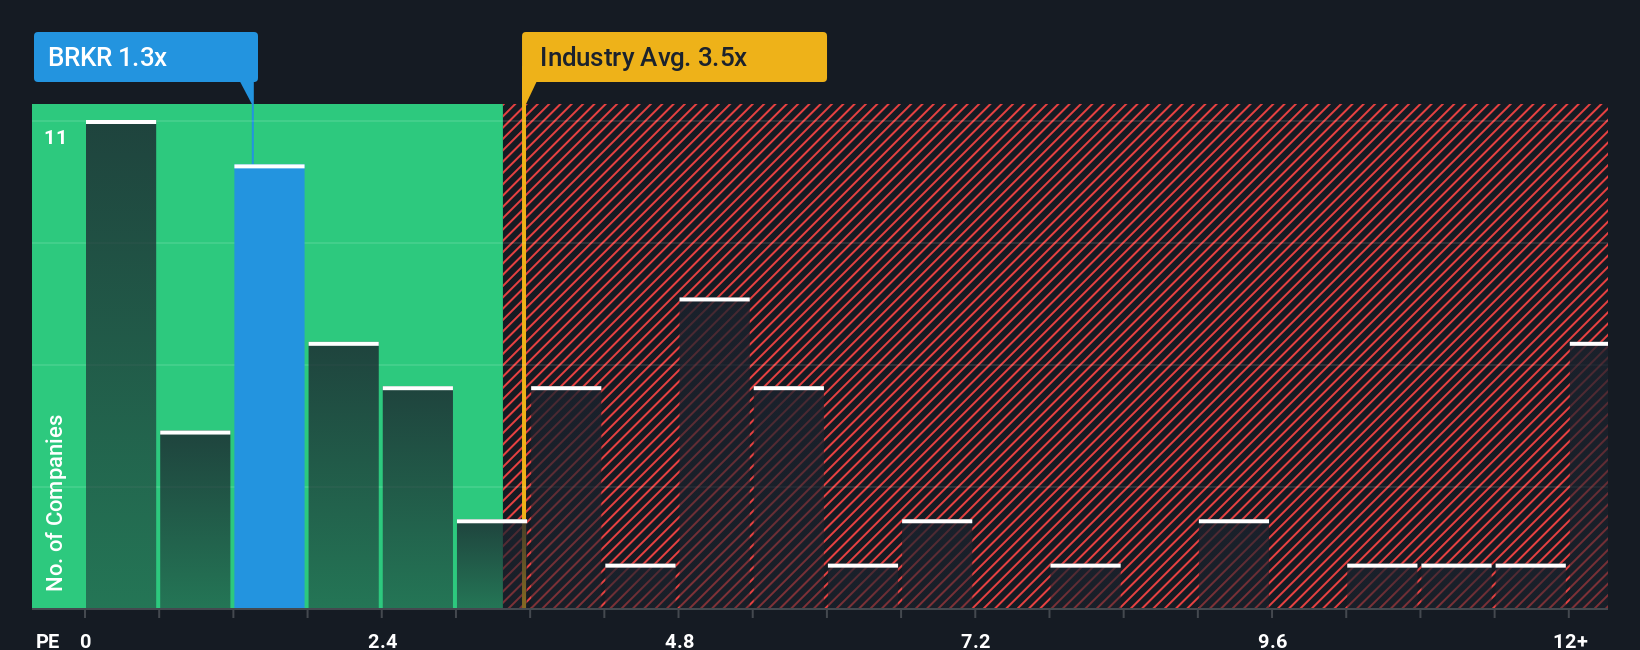
Although its price has dipped substantially, Bruker may still look like a strong buying opportunity at present with its price-to-sales (or "P/S") ratio of 1.3x, considering almost half of all companies in the Life Sciences industry in the United States have P/S ratios greater than 3.5x and even P/S higher than 6x aren't out of the ordinary. However, the P/S might be quite low for a reason and it requires further investigation to determine if it's justified.
Trump has pledged to "unleash" American oil and gas and these 15 US stocks have developments that are poised to benefit.
View our latest analysis for Bruker
How Has Bruker Performed Recently?
Bruker certainly has been doing a good job lately as it's been growing revenue more than most other companies. It might be that many expect the strong revenue performance to degrade substantially, which has repressed the share price, and thus the P/S ratio. If not, then existing shareholders have reason to be quite optimistic about the future direction of the share price.
Keen to find out how analysts think Bruker's future stacks up against the industry? In that case, our free report is a great place to start.What Are Revenue Growth Metrics Telling Us About The Low P/S?
In order to justify its P/S ratio, Bruker would need to produce anemic growth that's substantially trailing the industry.
Taking a look back first, we see that the company managed to grow revenues by a handy 10% last year. Pleasingly, revenue has also lifted 39% in aggregate from three years ago, partly thanks to the last 12 months of growth. Accordingly, shareholders would have definitely welcomed those medium-term rates of revenue growth.
Shifting to the future, estimates from the eleven analysts covering the company suggest revenue should grow by 3.2% per year over the next three years. Meanwhile, the rest of the industry is forecast to expand by 6.8% per year, which is noticeably more attractive.
With this information, we can see why Bruker is trading at a P/S lower than the industry. It seems most investors are expecting to see limited future growth and are only willing to pay a reduced amount for the stock.
What Does Bruker's P/S Mean For Investors?
Shares in Bruker have plummeted and its P/S has followed suit. While the price-to-sales ratio shouldn't be the defining factor in whether you buy a stock or not, it's quite a capable barometer of revenue expectations.
We've established that Bruker maintains its low P/S on the weakness of its forecast growth being lower than the wider industry, as expected. Right now shareholders are accepting the low P/S as they concede future revenue probably won't provide any pleasant surprises. Unless these conditions improve, they will continue to form a barrier for the share price around these levels.
Plus, you should also learn about these 3 warning signs we've spotted with Bruker (including 1 which can't be ignored).
If you're unsure about the strength of Bruker's business, why not explore our interactive list of stocks with solid business fundamentals for some other companies you may have missed.
Valuation is complex, but we're here to simplify it.
Discover if Bruker might be undervalued or overvalued with our detailed analysis, featuring fair value estimates, potential risks, dividends, insider trades, and its financial condition.
Access Free AnalysisHave feedback on this article? Concerned about the content? Get in touch with us directly. Alternatively, email editorial-team (at) simplywallst.com.This article by Simply Wall St is general in nature. We provide commentary based on historical data and analyst forecasts only using an unbiased methodology and our articles are not intended to be financial advice. It does not constitute a recommendation to buy or sell any stock, and does not take account of your objectives, or your financial situation. We aim to bring you long-term focused analysis driven by fundamental data. Note that our analysis may not factor in the latest price-sensitive company announcements or qualitative material. Simply Wall St has no position in any stocks mentioned.