
ANI Pharmaceuticals, Inc. (NASDAQ:ANIP) shares have continued their recent momentum with a 25% gain in the last month alone. Looking back a bit further, it's encouraging to see the stock is up 41% in the last year.
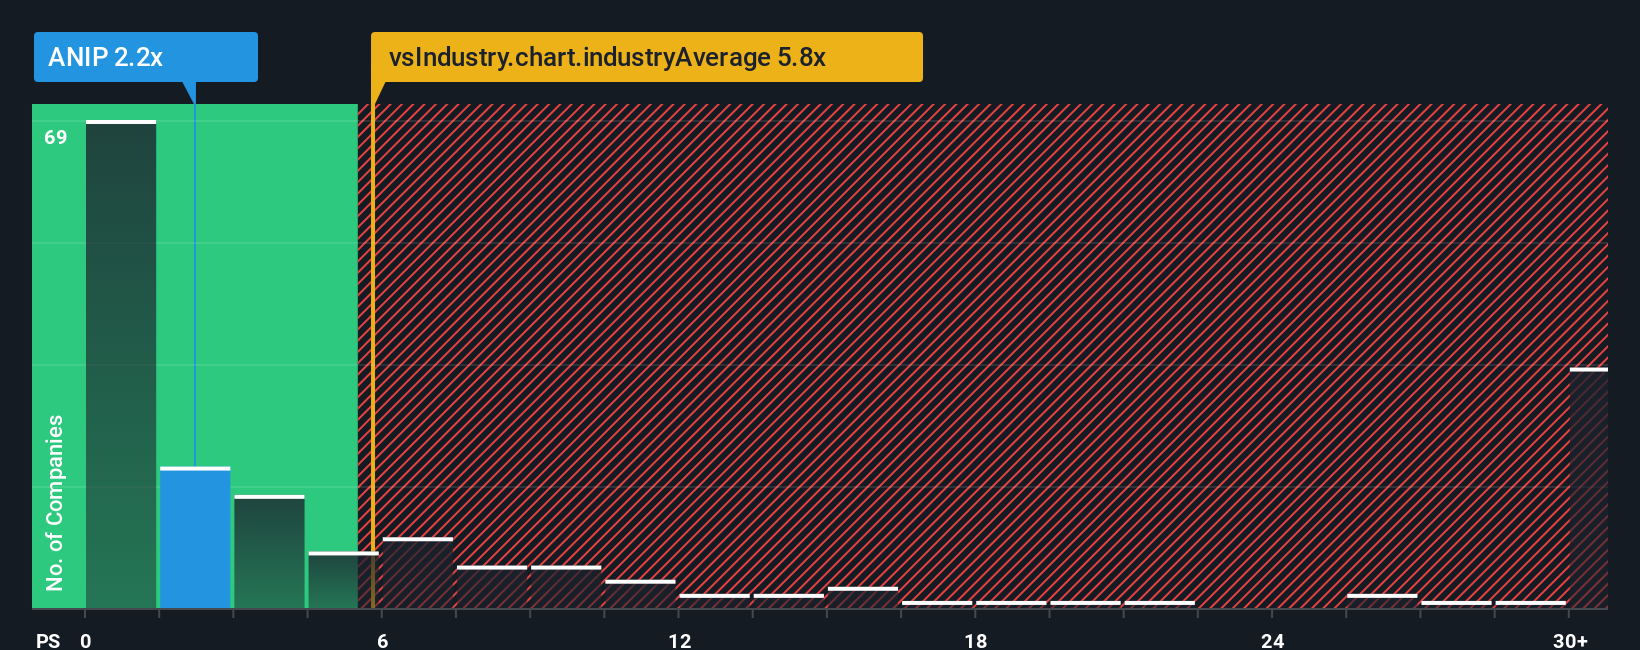
Even after such a large jump in price, ANI Pharmaceuticals may still look like a strong buying opportunity at present with its price-to-sales (or "P/S") ratio of 2.2x, considering almost half of all companies in the Pharmaceuticals industry in the United States have P/S ratios greater than 5.8x and even P/S higher than 18x aren't out of the ordinary. Nonetheless, we'd need to dig a little deeper to determine if there is a rational basis for the highly reduced P/S.
Trump has pledged to "unleash" American oil and gas and these 15 US stocks have developments that are poised to benefit.
Check out our latest analysis for ANI Pharmaceuticals
How ANI Pharmaceuticals Has Been Performing
ANI Pharmaceuticals certainly has been doing a good job lately as it's been growing revenue more than most other companies. One possibility is that the P/S ratio is low because investors think this strong revenue performance might be less impressive moving forward. If you like the company, you'd be hoping this isn't the case so that you could potentially pick up some stock while it's out of favour.
If you'd like to see what analysts are forecasting going forward, you should check out our free report on ANI Pharmaceuticals.Is There Any Revenue Growth Forecasted For ANI Pharmaceuticals?
The only time you'd be truly comfortable seeing a P/S as depressed as ANI Pharmaceuticals' is when the company's growth is on track to lag the industry decidedly.
If we review the last year of revenue growth, the company posted a terrific increase of 39%. The strong recent performance means it was also able to grow revenue by 197% in total over the last three years. So we can start by confirming that the company has done a great job of growing revenue over that time.
Looking ahead now, revenue is anticipated to climb by 8.9% per annum during the coming three years according to the eight analysts following the company. Meanwhile, the rest of the industry is forecast to expand by 26% per annum, which is noticeably more attractive.
With this information, we can see why ANI Pharmaceuticals is trading at a P/S lower than the industry. It seems most investors are expecting to see limited future growth and are only willing to pay a reduced amount for the stock.
The Final Word
ANI Pharmaceuticals' recent share price jump still sees fails to bring its P/S alongside the industry median. We'd say the price-to-sales ratio's power isn't primarily as a valuation instrument but rather to gauge current investor sentiment and future expectations.
We've established that ANI Pharmaceuticals maintains its low P/S on the weakness of its forecast growth being lower than the wider industry, as expected. At this stage investors feel the potential for an improvement in revenue isn't great enough to justify a higher P/S ratio. Unless these conditions improve, they will continue to form a barrier for the share price around these levels.
Before you take the next step, you should know about the 1 warning sign for ANI Pharmaceuticals that we have uncovered.
If strong companies turning a profit tickle your fancy, then you'll want to check out this free list of interesting companies that trade on a low P/E (but have proven they can grow earnings).
New: Manage All Your Stock Portfolios in One Place
We've created the ultimate portfolio companion for stock investors, and it's free.
• Connect an unlimited number of Portfolios and see your total in one currency• Be alerted to new Warning Signs or Risks via email or mobile• Track the Fair Value of your stocks
Try a Demo Portfolio for FreeHave feedback on this article? Concerned about the content? Get in touch with us directly. Alternatively, email editorial-team (at) simplywallst.com.This article by Simply Wall St is general in nature. We provide commentary based on historical data and analyst forecasts only using an unbiased methodology and our articles are not intended to be financial advice. It does not constitute a recommendation to buy or sell any stock, and does not take account of your objectives, or your financial situation. We aim to bring you long-term focused analysis driven by fundamental data. Note that our analysis may not factor in the latest price-sensitive company announcements or qualitative material. Simply Wall St has no position in any stocks mentioned.