Pinning Down AIA Group Limited's (HKG:1299) P/E Is Difficult Right Now
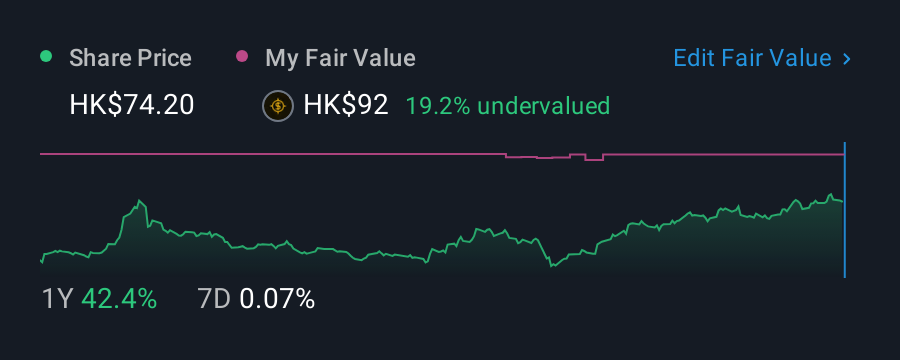
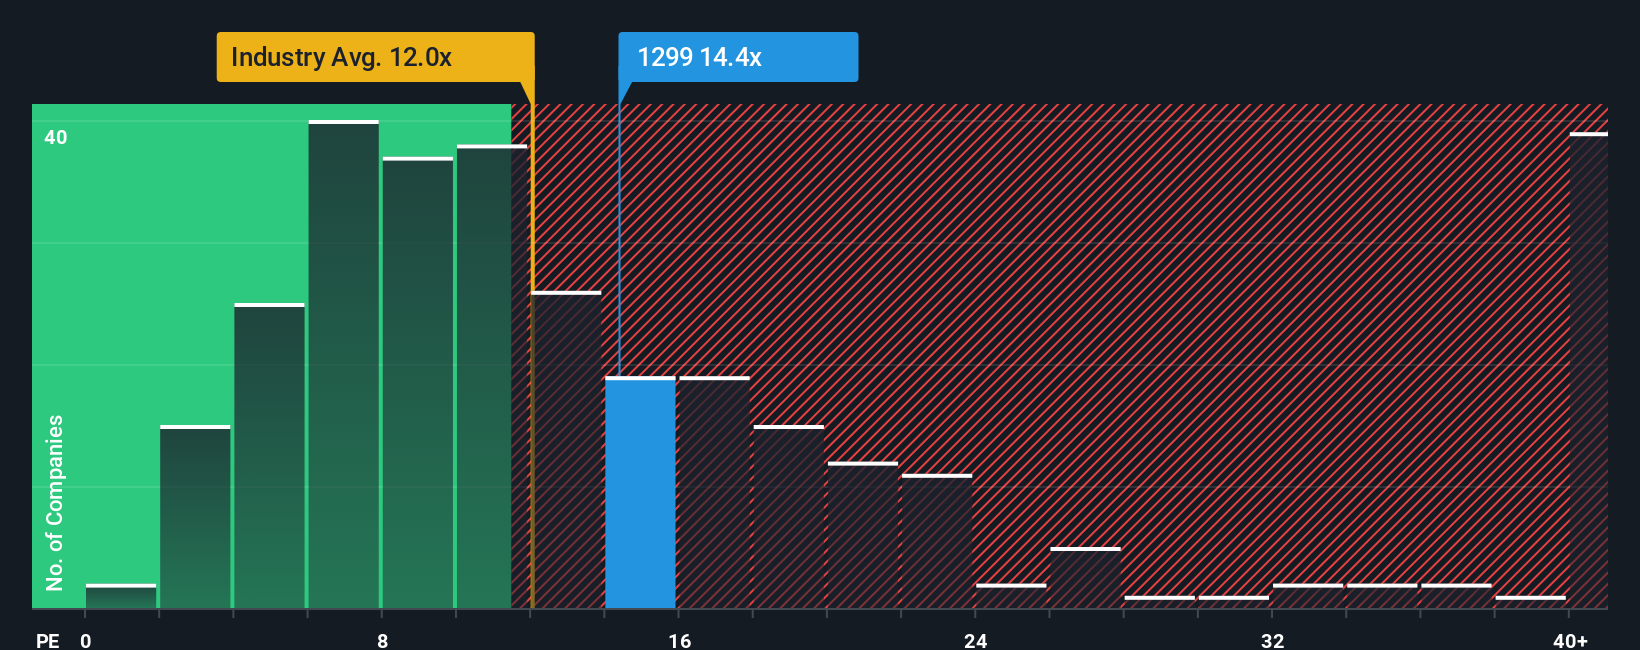
When close to half the companies in Hong Kong have price-to-earnings ratios (or "P/E's") below 12x, you may consider AIA Group Limited (HKG:1299) as a stock to potentially avoid with its 14.4x P/E ratio. Although, it's not wise to just take the P/E at face value as there may be an explanation why it's as high as it is.
AI is about to change healthcare. These 20 stocks are working on everything from early diagnostics to drug discovery. The best part - they are all under $10bn in marketcap - there is still time to get in early.
AIA Group certainly has been doing a good job lately as it's been growing earnings more than most other companies. It seems that many are expecting the strong earnings performance to persist, which has raised the P/E. You'd really hope so, otherwise you're paying a pretty hefty price for no particular reason.
Check out our latest analysis for AIA Group
What Are Growth Metrics Telling Us About The High P/E?
AIA Group's P/E ratio would be typical for a company that's expected to deliver solid growth, and importantly, perform better than the market.
If we review the last year of earnings growth, the company posted a terrific increase of 89%. The latest three year period has also seen a 6.1% overall rise in EPS, aided extensively by its short-term performance. Therefore, it's fair to say the earnings growth recently has been respectable for the company.
Turning to the outlook, the next three years should generate growth of 10.0% each year as estimated by the analysts watching the company. With the market predicted to deliver 15% growth each year, the company is positioned for a weaker earnings result.
With this information, we find it concerning that AIA Group is trading at a P/E higher than the market. It seems most investors are hoping for a turnaround in the company's business prospects, but the analyst cohort is not so confident this will happen. Only the boldest would assume these prices are sustainable as this level of earnings growth is likely to weigh heavily on the share price eventually.
The Final Word
While the price-to-earnings ratio shouldn't be the defining factor in whether you buy a stock or not, it's quite a capable barometer of earnings expectations.
Our examination of AIA Group's analyst forecasts revealed that its inferior earnings outlook isn't impacting its high P/E anywhere near as much as we would have predicted. Right now we are increasingly uncomfortable with the high P/E as the predicted future earnings aren't likely to support such positive sentiment for long. Unless these conditions improve markedly, it's very challenging to accept these prices as being reasonable.
The company's balance sheet is another key area for risk analysis. You can assess many of the main risks through our free balance sheet analysis for AIA Group with six simple checks.
If P/E ratios interest you, you may wish to see this free collection of other companies with strong earnings growth and low P/E ratios.
New: Manage All Your Stock Portfolios in One Place
We've created the ultimate portfolio companion for stock investors, and it's free.
• Connect an unlimited number of Portfolios and see your total in one currency• Be alerted to new Warning Signs or Risks via email or mobile• Track the Fair Value of your stocks
Try a Demo Portfolio for FreeHave feedback on this article? Concerned about the content? Get in touch with us directly. Alternatively, email editorial-team (at) simplywallst.com.This article by Simply Wall St is general in nature. We provide commentary based on historical data and analyst forecasts only using an unbiased methodology and our articles are not intended to be financial advice. It does not constitute a recommendation to buy or sell any stock, and does not take account of your objectives, or your financial situation. We aim to bring you long-term focused analysis driven by fundamental data. Note that our analysis may not factor in the latest price-sensitive company announcements or qualitative material. Simply Wall St has no position in any stocks mentioned.
Disclaimer: Investing carries risk. This is not financial advice. The above content should not be regarded as an offer, recommendation, or solicitation on acquiring or disposing of any financial products, any associated discussions, comments, or posts by author or other users should not be considered as such either. It is solely for general information purpose only, which does not consider your own investment objectives, financial situations or needs. TTM assumes no responsibility or warranty for the accuracy and completeness of the information, investors should do their own research and may seek professional advice before investing.
Most Discussed
- 1
- 2
- 3
- 4
- 5
- 6
- 7
- 8
- 9
- 10