The Market Doesn't Like What It Sees From Quest Resource Holding Corporation's (NASDAQ:QRHC) Revenues Yet
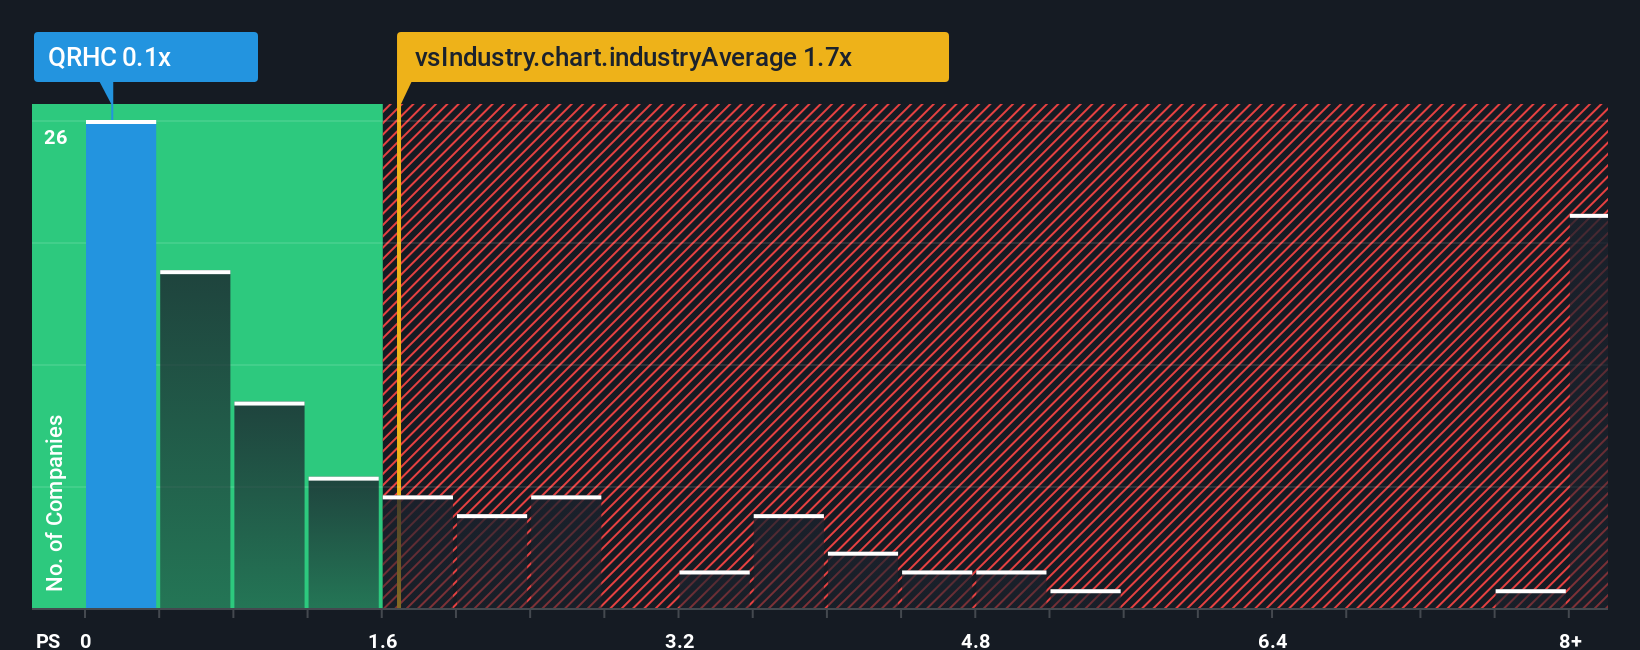
You may think that with a price-to-sales (or "P/S") ratio of 0.1x Quest Resource Holding Corporation (NASDAQ:QRHC) is a stock worth checking out, seeing as almost half of all the Commercial Services companies in the United States have P/S ratios greater than 1.7x and even P/S higher than 5x aren't out of the ordinary. Although, it's not wise to just take the P/S at face value as there may be an explanation why it's limited.
This technology could replace computers: discover the 20 stocks are working to make quantum computing a reality.
View our latest analysis for Quest Resource Holding
What Does Quest Resource Holding's P/S Mean For Shareholders?
Quest Resource Holding could be doing better as its revenue has been going backwards lately while most other companies have been seeing positive revenue growth. Perhaps the P/S remains low as investors think the prospects of strong revenue growth aren't on the horizon. If you still like the company, you'd be hoping this isn't the case so that you could potentially pick up some stock while it's out of favour.
Keen to find out how analysts think Quest Resource Holding's future stacks up against the industry? In that case, our free report is a great place to start.How Is Quest Resource Holding's Revenue Growth Trending?
Quest Resource Holding's P/S ratio would be typical for a company that's only expected to deliver limited growth, and importantly, perform worse than the industry.
Retrospectively, the last year delivered a frustrating 5.2% decrease to the company's top line. That put a dampener on the good run it was having over the longer-term as its three-year revenue growth is still a noteworthy 17% in total. Accordingly, while they would have preferred to keep the run going, shareholders would be roughly satisfied with the medium-term rates of revenue growth.
Shifting to the future, estimates from the three analysts covering the company suggest revenue growth is heading into negative territory, declining 5.8% over the next year. With the industry predicted to deliver 6.7% growth, that's a disappointing outcome.
With this information, we are not surprised that Quest Resource Holding is trading at a P/S lower than the industry. Nonetheless, there's no guarantee the P/S has reached a floor yet with revenue going in reverse. There's potential for the P/S to fall to even lower levels if the company doesn't improve its top-line growth.
The Key Takeaway
We'd say the price-to-sales ratio's power isn't primarily as a valuation instrument but rather to gauge current investor sentiment and future expectations.
It's clear to see that Quest Resource Holding maintains its low P/S on the weakness of its forecast for sliding revenue, as expected. As other companies in the industry are forecasting revenue growth, Quest Resource Holding's poor outlook justifies its low P/S ratio. Unless there's material change, it's hard to envision a situation where the stock price will rise drastically.
We don't want to rain on the parade too much, but we did also find 3 warning signs for Quest Resource Holding that you need to be mindful of.
If companies with solid past earnings growth is up your alley, you may wish to see this free collection of other companies with strong earnings growth and low P/E ratios.
Valuation is complex, but we're here to simplify it.
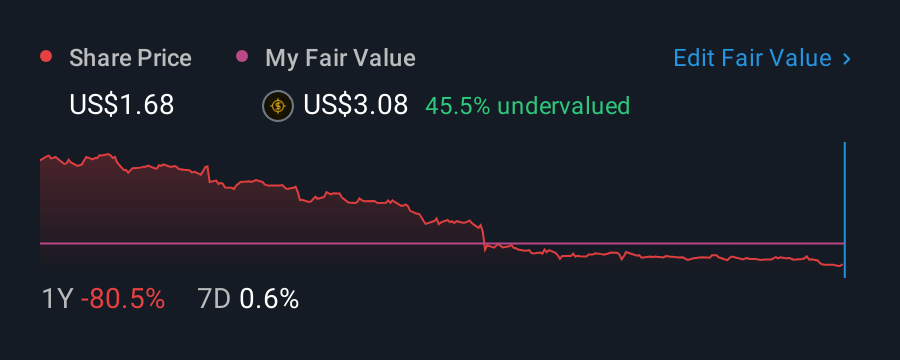
Discover if Quest Resource Holding might be undervalued or overvalued with our detailed analysis, featuring fair value estimates, potential risks, dividends, insider trades, and its financial condition.
Access Free AnalysisHave feedback on this article? Concerned about the content? Get in touch with us directly. Alternatively, email editorial-team (at) simplywallst.com.This article by Simply Wall St is general in nature. We provide commentary based on historical data and analyst forecasts only using an unbiased methodology and our articles are not intended to be financial advice. It does not constitute a recommendation to buy or sell any stock, and does not take account of your objectives, or your financial situation. We aim to bring you long-term focused analysis driven by fundamental data. Note that our analysis may not factor in the latest price-sensitive company announcements or qualitative material. Simply Wall St has no position in any stocks mentioned.
Disclaimer: Investing carries risk. This is not financial advice. The above content should not be regarded as an offer, recommendation, or solicitation on acquiring or disposing of any financial products, any associated discussions, comments, or posts by author or other users should not be considered as such either. It is solely for general information purpose only, which does not consider your own investment objectives, financial situations or needs. TTM assumes no responsibility or warranty for the accuracy and completeness of the information, investors should do their own research and may seek professional advice before investing.
Most Discussed
- 1
- 2
- 3
- 4
- 5
- 6
- 7
- 8
- 9
- 10