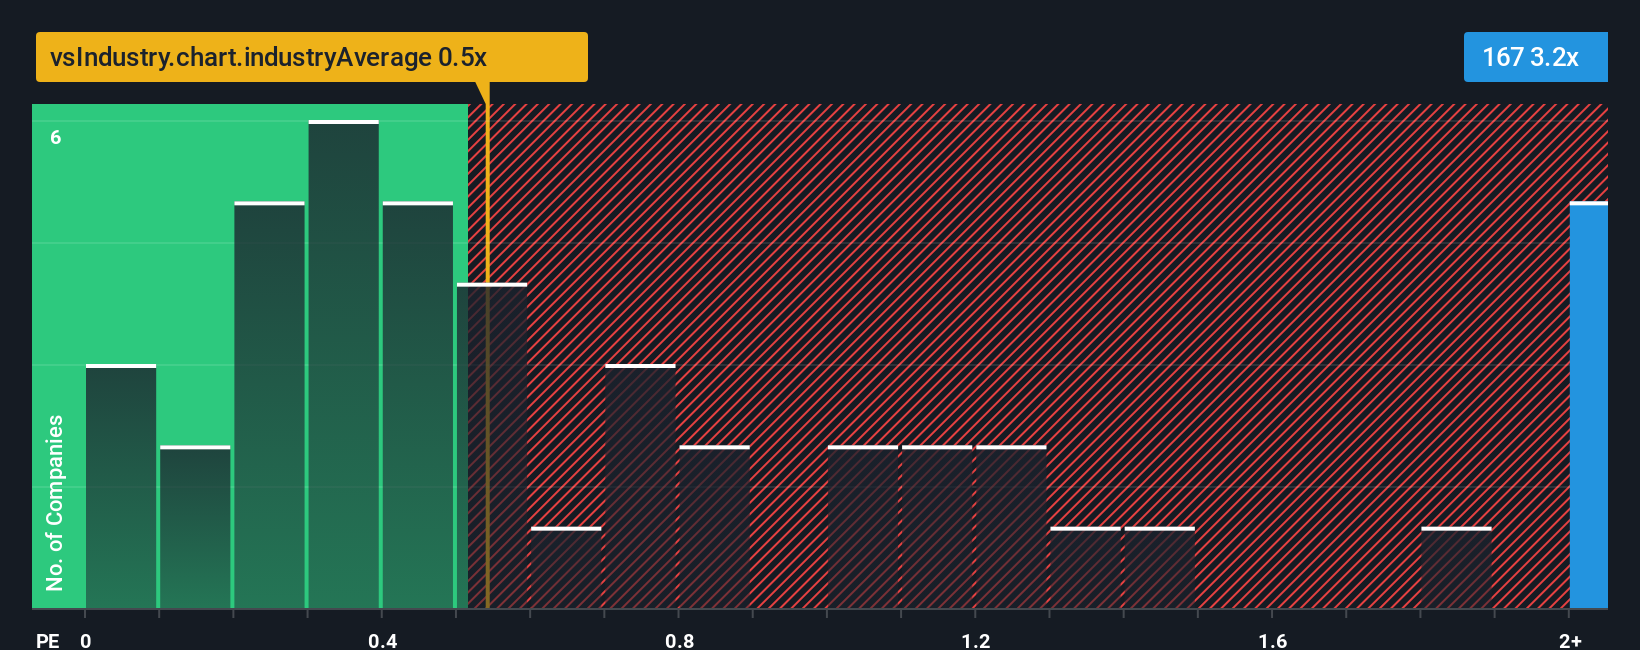
IDT International Limited's (HKG:167) price-to-sales (or "P/S") ratio of 3.2x may look like a poor investment opportunity when you consider close to half the companies in the Consumer Durables industry in Hong Kong have P/S ratios below 0.5x. However, the P/S might be quite high for a reason and it requires further investigation to determine if it's justified.
We've found 21 US stocks that are forecast to pay a dividend yield of over 6% next year. See the full list for free.
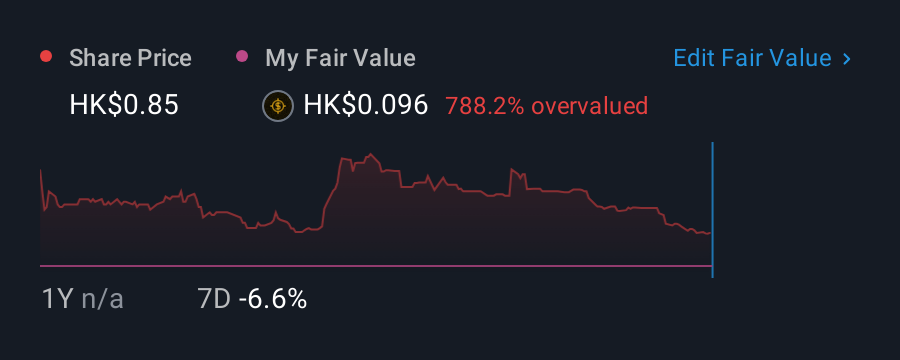
Check out our latest analysis for IDT International
What Does IDT International's Recent Performance Look Like?
Recent times have been quite advantageous for IDT International as its revenue has been rising very briskly. The P/S ratio is probably high because investors think this strong revenue growth will be enough to outperform the broader industry in the near future. You'd really hope so, otherwise you're paying a pretty hefty price for no particular reason.
We don't have analyst forecasts, but you can see how recent trends are setting up the company for the future by checking out our free report on IDT International's earnings, revenue and cash flow.Do Revenue Forecasts Match The High P/S Ratio?
In order to justify its P/S ratio, IDT International would need to produce outstanding growth that's well in excess of the industry.
Taking a look back first, we see that the company's revenues underwent some rampant growth over the last 12 months. Spectacularly, three year revenue growth has also set the world alight, thanks to the last 12 months of incredible growth. Accordingly, shareholders would have been over the moon with those medium-term rates of revenue growth.
When compared to the industry's one-year growth forecast of 8.7%, the most recent medium-term revenue trajectory is noticeably more alluring
With this information, we can see why IDT International is trading at such a high P/S compared to the industry. Presumably shareholders aren't keen to offload something they believe will continue to outmanoeuvre the wider industry.
The Final Word
It's argued the price-to-sales ratio is an inferior measure of value within certain industries, but it can be a powerful business sentiment indicator.
As we suspected, our examination of IDT International revealed its three-year revenue trends are contributing to its high P/S, given they look better than current industry expectations. At this stage investors feel the potential continued revenue growth in the future is great enough to warrant an inflated P/S. Unless the recent medium-term conditions change, they will continue to provide strong support to the share price.
And what about other risks? Every company has them, and we've spotted 6 warning signs for IDT International (of which 3 don't sit too well with us!) you should know about.
Of course, profitable companies with a history of great earnings growth are generally safer bets. So you may wish to see this free collection of other companies that have reasonable P/E ratios and have grown earnings strongly.
New: AI Stock Screener & Alerts
Our new AI Stock Screener scans the market every day to uncover opportunities.
• Dividend Powerhouses (3%+ Yield)• Undervalued Small Caps with Insider Buying• High growth Tech and AI CompaniesOr build your own from over 50 metrics.
Explore Now for FreeHave feedback on this article? Concerned about the content? Get in touch with us directly. Alternatively, email editorial-team (at) simplywallst.com.This article by Simply Wall St is general in nature. We provide commentary based on historical data and analyst forecasts only using an unbiased methodology and our articles are not intended to be financial advice. It does not constitute a recommendation to buy or sell any stock, and does not take account of your objectives, or your financial situation. We aim to bring you long-term focused analysis driven by fundamental data. Note that our analysis may not factor in the latest price-sensitive company announcements or qualitative material. Simply Wall St has no position in any stocks mentioned.