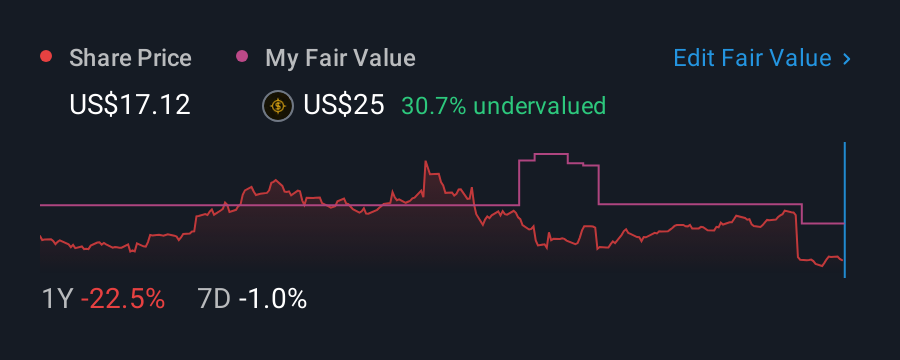
Confluent, Inc. (NASDAQ:CFLT) shareholders won't be pleased to see that the share price has had a very rough month, dropping 32% and undoing the prior period's positive performance. Instead of being rewarded, shareholders who have already held through the last twelve months are now sitting on a 20% share price drop.
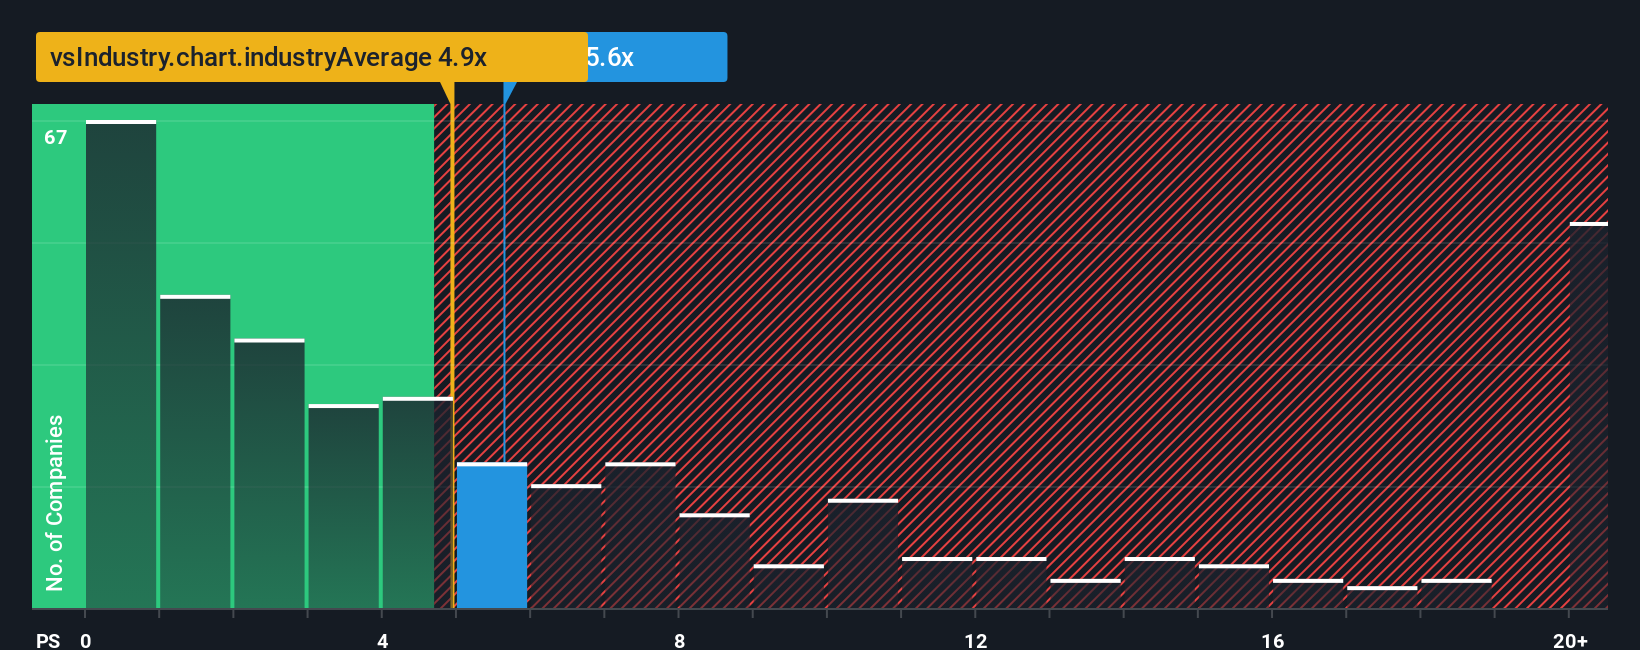
Although its price has dipped substantially, there still wouldn't be many who think Confluent's price-to-sales (or "P/S") ratio of 5.6x is worth a mention when the median P/S in the United States' Software industry is similar at about 4.9x. Although, it's not wise to simply ignore the P/S without explanation as investors may be disregarding a distinct opportunity or a costly mistake.
This technology could replace computers: discover the 20 stocks are working to make quantum computing a reality.
View our latest analysis for Confluent
How Confluent Has Been Performing
Recent times have been advantageous for Confluent as its revenues have been rising faster than most other companies. Perhaps the market is expecting this level of performance to taper off, keeping the P/S from soaring. If the company manages to stay the course, then investors should be rewarded with a share price that matches its revenue figures.
Keen to find out how analysts think Confluent's future stacks up against the industry? In that case, our free report is a great place to start.What Are Revenue Growth Metrics Telling Us About The P/S?
Confluent's P/S ratio would be typical for a company that's only expected to deliver moderate growth, and importantly, perform in line with the industry.
If we review the last year of revenue growth, the company posted a terrific increase of 23%. The strong recent performance means it was also able to grow revenue by 118% in total over the last three years. Therefore, it's fair to say the revenue growth recently has been superb for the company.
Looking ahead now, revenue is anticipated to climb by 17% each year during the coming three years according to the analysts following the company. With the industry predicted to deliver 38% growth per year, the company is positioned for a weaker revenue result.
With this information, we find it interesting that Confluent is trading at a fairly similar P/S compared to the industry. Apparently many investors in the company are less bearish than analysts indicate and aren't willing to let go of their stock right now. These shareholders may be setting themselves up for future disappointment if the P/S falls to levels more in line with the growth outlook.
The Final Word
Confluent's plummeting stock price has brought its P/S back to a similar region as the rest of the industry. Generally, our preference is to limit the use of the price-to-sales ratio to establishing what the market thinks about the overall health of a company.
Given that Confluent's revenue growth projections are relatively subdued in comparison to the wider industry, it comes as a surprise to see it trading at its current P/S ratio. At present, we aren't confident in the P/S as the predicted future revenues aren't likely to support a more positive sentiment for long. A positive change is needed in order to justify the current price-to-sales ratio.
There are also other vital risk factors to consider before investing and we've discovered 2 warning signs for Confluent that you should be aware of.
If you're unsure about the strength of Confluent's business, why not explore our interactive list of stocks with solid business fundamentals for some other companies you may have missed.
New: AI Stock Screener & Alerts
Our new AI Stock Screener scans the market every day to uncover opportunities.
• Dividend Powerhouses (3%+ Yield)• Undervalued Small Caps with Insider Buying• High growth Tech and AI CompaniesOr build your own from over 50 metrics.
Explore Now for FreeHave feedback on this article? Concerned about the content? Get in touch with us directly. Alternatively, email editorial-team (at) simplywallst.com.This article by Simply Wall St is general in nature. We provide commentary based on historical data and analyst forecasts only using an unbiased methodology and our articles are not intended to be financial advice. It does not constitute a recommendation to buy or sell any stock, and does not take account of your objectives, or your financial situation. We aim to bring you long-term focused analysis driven by fundamental data. Note that our analysis may not factor in the latest price-sensitive company announcements or qualitative material. Simply Wall St has no position in any stocks mentioned.