Genesis Minerals (ASX:GMD) Full Year 2025 Results
Key Financial Results
- Revenue: AU$920.1m (up 110% from FY 2024).
- Net income: AU$221.2m (up 124% from FY 2024).
- Profit margin: 24% (up from 23% in FY 2024). The increase in margin was driven by higher revenue.
- EPS: AU$0.20 (up from AU$0.091 in FY 2024).
AI is about to change healthcare. These 20 stocks are working on everything from early diagnostics to drug discovery. The best part - they are all under $10bn in marketcap - there is still time to get in early.
GMD Production and Reserves
Gold- Production: 214.31 troy koz (134.45 troy koz in FY 2024)
- Proved and probable reserves (ore): 54 Mt (45.4 Mt in FY 2024)
- Number of mines: 1 (1 in FY 2024)
All figures shown in the chart above are for the trailing 12 month (TTM) period
Genesis Minerals EPS Misses Expectations
Revenue was in line with analyst estimates. Earnings per share (EPS) missed analyst estimates by 1.3%.
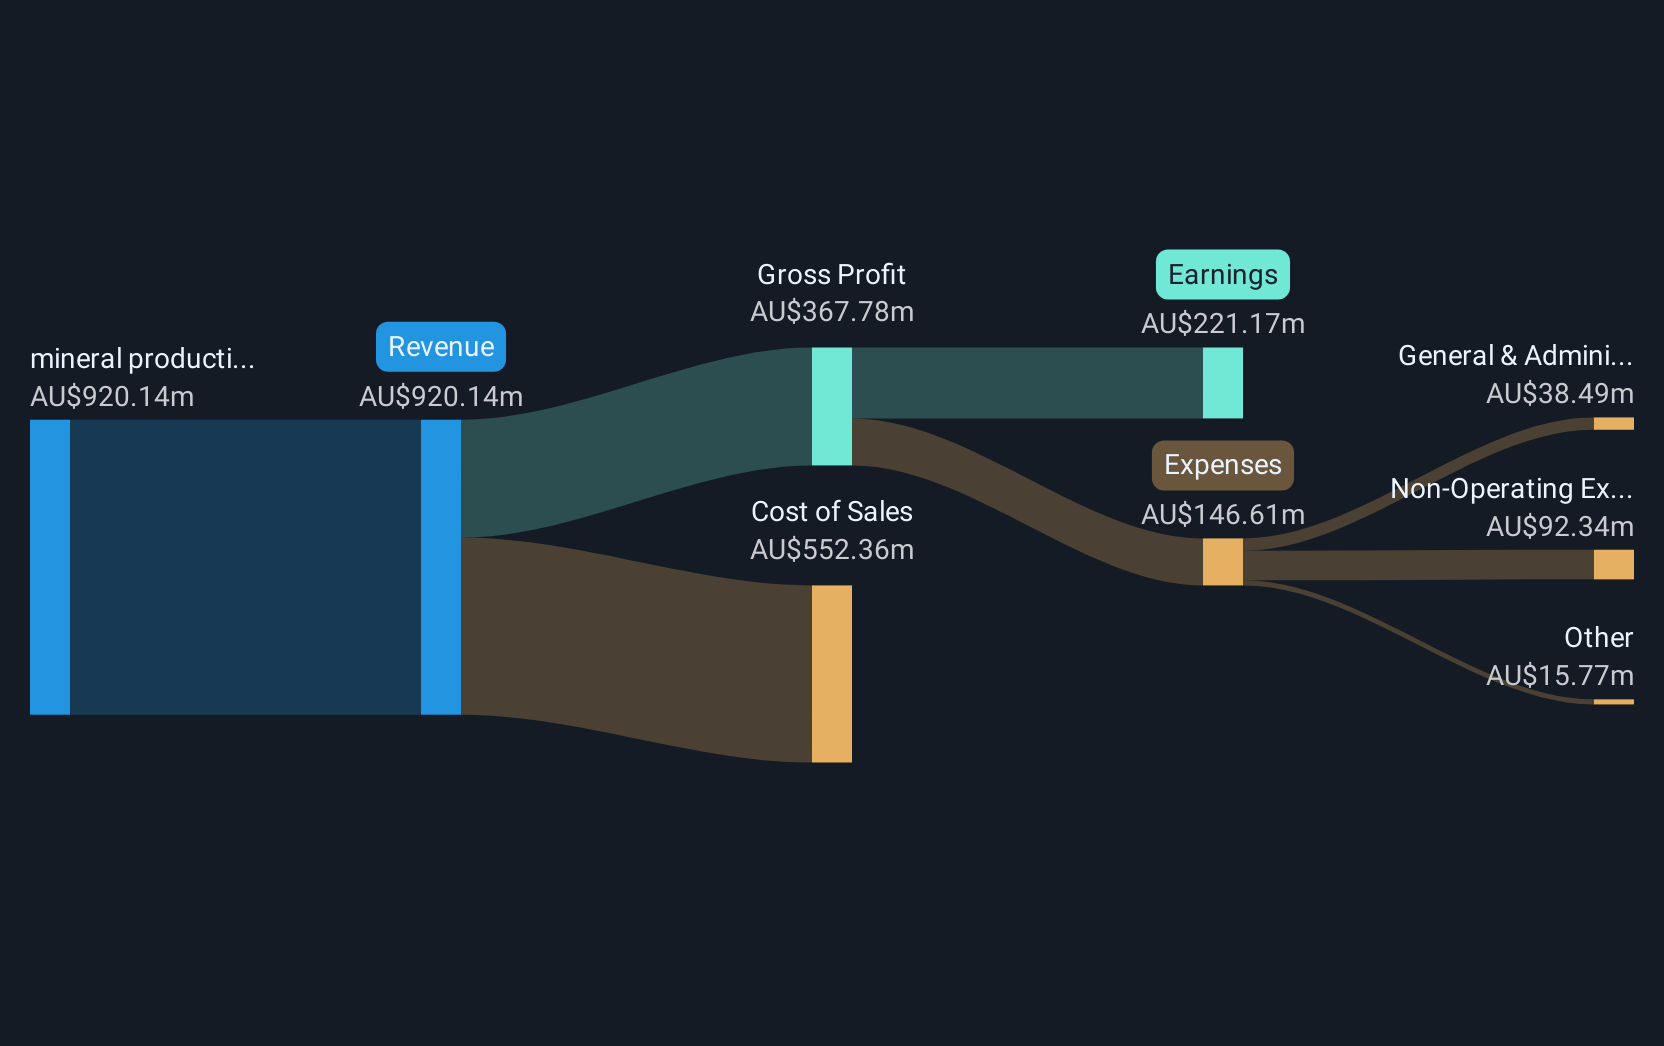
In the last 12 months, the only revenue segment was mineral production, exploration and development contributing AU$920.1m. Notably, cost of sales worth AU$552.4m amounted to 60% of total revenue thereby underscoring the impact on earnings. The most substantial expense, totaling AU$92.3m were related to Non-Operating costs. This indicates that a significant portion of the company's costs is related to non-core activities. Explore how GMD's revenue and expenses shape its earnings.
Looking ahead, revenue is forecast to grow 11% p.a. on average during the next 3 years, compared to a 5.4% growth forecast for the Metals and Mining industry in Australia.
Performance of the Australian Metals and Mining industry.
The company's shares are down 6.9% from a week ago.
Balance Sheet Analysis
While it's very important to consider the profit and loss statement, you can also learn a lot about a company by looking at its balance sheet. We have a graphic representation of Genesis Minerals' balance sheet and an in-depth analysis of the company's financial position.
New: Manage All Your Stock Portfolios in One Place
We've created the ultimate portfolio companion for stock investors, and it's free.
• Connect an unlimited number of Portfolios and see your total in one currency• Be alerted to new Warning Signs or Risks via email or mobile• Track the Fair Value of your stocks
Try a Demo Portfolio for FreeHave feedback on this article? Concerned about the content? Get in touch with us directly. Alternatively, email editorial-team (at) simplywallst.com.This article by Simply Wall St is general in nature. We provide commentary based on historical data and analyst forecasts only using an unbiased methodology and our articles are not intended to be financial advice. It does not constitute a recommendation to buy or sell any stock, and does not take account of your objectives, or your financial situation. We aim to bring you long-term focused analysis driven by fundamental data. Note that our analysis may not factor in the latest price-sensitive company announcements or qualitative material. Simply Wall St has no position in any stocks mentioned.