Asian Market Value Stocks: J&T Global Express Among 3 Picks Trading Below Estimated Fair Value
As the Asian markets navigate a landscape shaped by easing U.S.-China trade tensions and mixed economic signals from China, investors are increasingly attentive to opportunities that arise from stocks trading below their estimated fair value. In this context, identifying undervalued stocks can be particularly appealing, offering potential for growth in an environment where market dynamics are influenced by broader economic developments.
Top 10 Undervalued Stocks Based On Cash Flows In Asia
| Name | Current Price | Fair Value (Est) | Discount (Est) |
| Xi'an NovaStar Tech (SZSE:301589) | CN¥160.67 | CN¥312.31 | 48.6% |
| Sunjin Beauty ScienceLtd (KOSDAQ:A086710) | ₩10720.00 | ₩21037.18 | 49% |
| SRE Holdings (TSE:2980) | ¥3115.00 | ¥6106.05 | 49% |
| SK Biopharmaceuticals (KOSE:A326030) | ₩97200.00 | ₩189933.83 | 48.8% |
| Matsuya R&DLtd (TSE:7317) | ¥717.00 | ¥1428.98 | 49.8% |
| Lotes (TWSE:3533) | NT$1350.00 | NT$2686.73 | 49.8% |
| Kolmar Korea (KOSE:A161890) | ₩79600.00 | ₩155807.48 | 48.9% |
| Jiangxi Rimag Group (SEHK:2522) | HK$19.16 | HK$37.57 | 49% |
| Fositek (TWSE:6805) | NT$1060.00 | NT$2092.67 | 49.3% |
| EROAD (NZSE:ERD) | NZ$2.35 | NZ$4.63 | 49.2% |
Click here to see the full list of 269 stocks from our Undervalued Asian Stocks Based On Cash Flows screener.
Below we spotlight a couple of our favorites from our exclusive screener.
J&T Global Express (SEHK:1519)
Overview: J&T Global Express Limited is an investment holding company that provides integrated express delivery services across several countries including China, Indonesia, and Brazil, with a market cap of HK$97.15 billion.
Operations: The company generates revenue from its transportation segment, specifically air freight, amounting to $10.26 billion.
Estimated Discount To Fair Value: 27.9%
J&T Global Express is trading at HK$10.92, 27.9% below its estimated fair value of HK$15.14, suggesting undervaluation based on cash flows. The company recently became profitable and expects annual earnings growth of 32.4%, outpacing the Hong Kong market's 11.1%. Revenue is forecast to grow at 11.2% annually, supported by a significant increase in parcel volume, which rose by 27% year-on-year in the first half of 2025.
- In light of our recent growth report, it seems possible that J&T Global Express' financial performance will exceed current levels.
- Click to explore a detailed breakdown of our findings in J&T Global Express' balance sheet health report.
GEM (SZSE:002340)
Overview: GEM Co., Ltd. operates in the waste resource comprehensive utilization industry both in China and internationally, with a market cap of CN¥34.77 billion.
Operations: GEM Co., Ltd. generates revenue through its operations in the waste resource comprehensive utilization industry, serving both domestic and international markets.
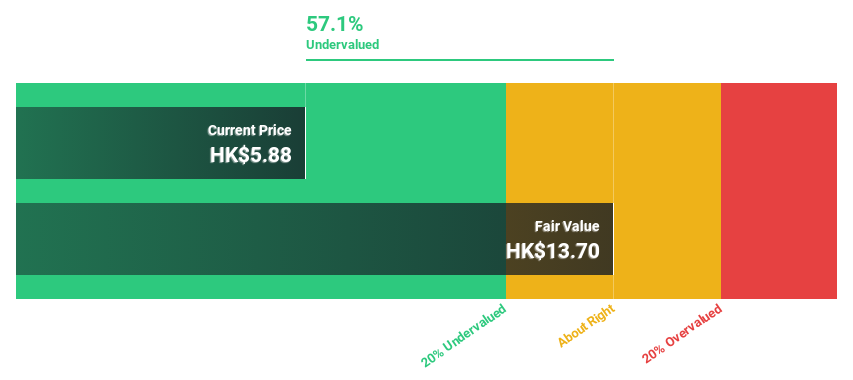
Estimated Discount To Fair Value: 48.3%
GEM is trading at CN¥6.82, significantly below its estimated fair value of CN¥13.19, highlighting its undervaluation based on cash flows. Despite a low forecasted return on equity of 11.6% in three years, earnings are expected to grow significantly at 34.9% annually, surpassing the Chinese market's growth rate of 24.3%. However, debt coverage by operating cash flow is inadequate and the dividend yield of 0.97% isn't well supported by free cash flows. The company completed a share buyback program worth CN¥138.05 million recently.
- Upon reviewing our latest growth report, GEM's projected financial performance appears quite optimistic.
- Navigate through the intricacies of GEM with our comprehensive financial health report here.

Anhui Jinhe IndustrialLtd (SZSE:002597)
Overview: Anhui Jinhe Industrial Co., Ltd. operates in the chemicals industry in China with a market capitalization of CN¥13.16 billion.
Operations: Anhui Jinhe Industrial Co., Ltd. generates revenue from its operations in the chemicals sector within China.
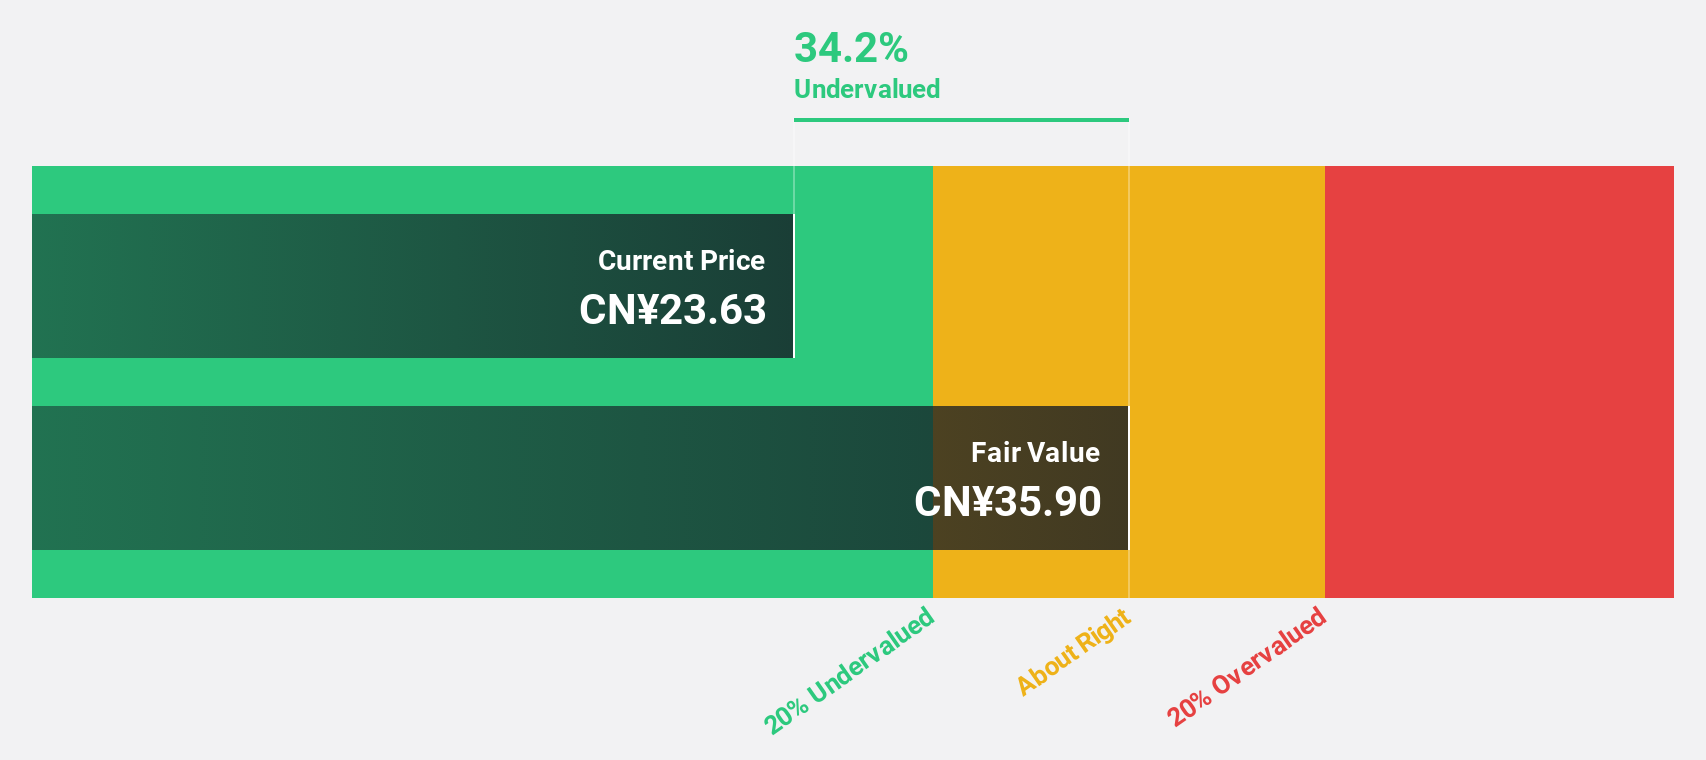
Estimated Discount To Fair Value: 34.7%
Anhui Jinhe Industrial Ltd. is trading at CN¥24.05, well below its estimated fair value of CN¥36.84, suggesting undervaluation based on cash flows. Its earnings are forecast to grow significantly at 31.7% annually, outpacing the Chinese market's growth rate of 24.3%. However, revenue growth is slower than ideal and its dividend yield of 3.45% isn't adequately covered by free cash flows. Recent amendments to company bylaws may impact governance structures moving forward.
- The analysis detailed in our Anhui Jinhe IndustrialLtd growth report hints at robust future financial performance.
- Get an in-depth perspective on Anhui Jinhe IndustrialLtd's balance sheet by reading our health report here.
Next Steps
- Unlock our comprehensive list of 269 Undervalued Asian Stocks Based On Cash Flows by clicking here.
- Already own these companies? Bring clarity to your investment decisions by linking up your portfolio with Simply Wall St, where you can monitor all the vital signs of your stocks effortlessly.
- Streamline your investment strategy with Simply Wall St's app for free and benefit from extensive research on stocks across all corners of the world.
Contemplating Other Strategies?
- Explore high-performing small cap companies that haven't yet garnered significant analyst attention.
- Diversify your portfolio with solid dividend payers offering reliable income streams to weather potential market turbulence.
- Fuel your portfolio with companies showing strong growth potential, backed by optimistic outlooks both from analysts and management.
This article by Simply Wall St is general in nature. We provide commentary based on historical data and analyst forecasts only using an unbiased methodology and our articles are not intended to be financial advice. It does not constitute a recommendation to buy or sell any stock, and does not take account of your objectives, or your financial situation. We aim to bring you long-term focused analysis driven by fundamental data. Note that our analysis may not factor in the latest price-sensitive company announcements or qualitative material. Simply Wall St has no position in any stocks mentioned.
New: Manage All Your Stock Portfolios in One Place
We've created the ultimate portfolio companion for stock investors, and it's free.
• Connect an unlimited number of Portfolios and see your total in one currency• Be alerted to new Warning Signs or Risks via email or mobile• Track the Fair Value of your stocks
Try a Demo Portfolio for FreeHave feedback on this article? Concerned about the content? Get in touch with us directly. Alternatively, email editorial-team@simplywallst.com
Disclaimer: Investing carries risk. This is not financial advice. The above content should not be regarded as an offer, recommendation, or solicitation on acquiring or disposing of any financial products, any associated discussions, comments, or posts by author or other users should not be considered as such either. It is solely for general information purpose only, which does not consider your own investment objectives, financial situations or needs. TTM assumes no responsibility or warranty for the accuracy and completeness of the information, investors should do their own research and may seek professional advice before investing.
Most Discussed
- 1
- 2
- 3
- 4
- 5
- 6
- 7
- 8
- 9
- 10