Is Now the Time to Buy Vanguard High Dividend Yield ETF (VYM)?
-
The Vanguard High Dividend Yield ETF currently has double the dividend yield compared to the S&P 500.
-
Companies in the fund also trade at lower valuations compared with the broader market.
-
Slower earnings growth could yield lower total returns.
The Vanguard High Dividend Yield ETF (VYM 0.27%) follows a very simple strategy. It tracks an index that measures the returns of stocks with high dividend yields. That approach means that this exchange-traded fund (ETF) can provide investors with a lucrative stream of passive dividend income.
Here's a look at whether now is a good time to buy this top dividend ETF.

Image source: Getty Images.
An easy way to boost your dividend income
The Vanguard High Dividend Yield ETF holds over 580 stocks, most of which have above-average dividend yields. The fund currently has a 2.6% dividend yield. That's more than double the S&P 500's dividend yield, which at less than 1.2% is approaching its record low.
VYM holds several notable higher-yielding dividend stocks. For example, ExxonMobil (XOM -0.02%) is the fund's third largest holding, accounting for 2.4% of its assets. The oil giant's dividend yield is currently over 3.5%. Exxon also has an exceptional record of increasing its dividend. It has raised its dividend for 42 straight years. That's the longest streak in the oil patch and a milestone only 4% of companies in the S&P 500 have reached.
The fund's focus on investing in stocks with higher dividend yields enables it to generate more income for investors. For example, every $1,000 invested in the Vanguard High Dividend Yield ETF would produce about $26 of annual dividend income. That compares to around $12 in dividend income from a similar investment in an S&P 500 ETF such as the Vanguard S&P 500 ETF (VOO 0.41%). While investors pay a slightly higher ETF expense ratio for YVM, at 0.06%, compared with 0.03% for VOO, it costs them only about $0.60 each year, compared with $0.30 annually for VOO. So they'll still collect a lot more dividend income with this ETF.
A relatively more attractive valuation
One reason the Vanguard High Dividend Yield ETF offers a much higher yield compared to the broader market is that it holds companies trading at lower valuations. The 580 stocks currently held by the ETF trade at a price-to-earnings (P/E) ratio of 19.6 and a price-to-book (P/B) ratio of 2.8. That compares with a P/E ratio of 27.6 and a P/B ratio of 5.0.
That higher valuation is due in part to the S&P 500's bigger run-up over the past year compared with VYM:
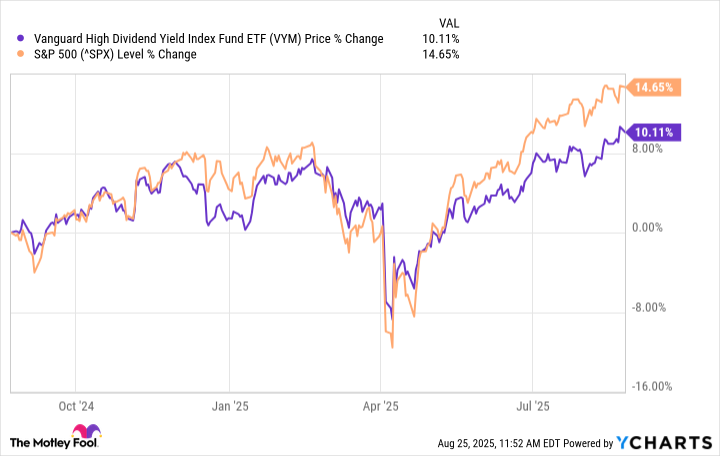
VYM data by YCharts
In addition, higher-yielding companies often trade at lower valuations because they tend to be slower-growing. For example, VYM stocks have averaged 13.3% annual earnings growth over the past five years. That compares to S&P 500 companies, which have achieved a 23.4% average annual earnings growth rate over the past five years. The average S&P 500 company tends to retain a greater percentage of its earnings to fund its continued growth, whereas the typical YYM holding allocates a larger portion of its income to paying dividends.
While value-oriented income stocks in the Vanguard High Dividend Yield ETF likely won't outperform an S&P 500 index fund over the long term, the fund has still delivered solid returns over the past decade:
Fund | 1-Year | 3-Year | 5-Year | 10-Year |
|---|---|---|---|---|
VYM | 10.9% | 11.3% | 14% | 10.4% |
VOO | 16.3% | 17.1% | 15.9% | 13.6% |
Data source: Vanguard.
Given its lower relative valuation and higher income yield, VYM should continue delivering solid total returns for its investors, likely with less volatility compared with an S&P 500 index fund.
A rock-solid dividend ETF to buy and hold long term
If you want to collect more dividend income, consider buying the Vanguard High Dividend Yield ETF right now. This fund delivers a more attractive income stream compared to the broader market, partly because it holds stocks with lower relative valuations. While this ETF may not outperform the more growth-oriented S&P 500 over the long term, as it aims to deliver more income rather than high growth, it provides investors with a solid option for income and less volatile stock market exposure.
Disclaimer: Investing carries risk. This is not financial advice. The above content should not be regarded as an offer, recommendation, or solicitation on acquiring or disposing of any financial products, any associated discussions, comments, or posts by author or other users should not be considered as such either. It is solely for general information purpose only, which does not consider your own investment objectives, financial situations or needs. TTM assumes no responsibility or warranty for the accuracy and completeness of the information, investors should do their own research and may seek professional advice before investing.
Most Discussed
- 1
- 2
- 3
- 4
- 5
- 6
- 7
- 8
- 9
- 10