Easyknit International Holdings Limited's (HKG:1218) Shares Leap 56% Yet They're Still Not Telling The Full Story
Easyknit International Holdings Limited (HKG:1218) shares have had a really impressive month, gaining 56% after a shaky period beforehand. Unfortunately, the gains of the last month did little to right the losses of the last year with the stock still down 12% over that time.
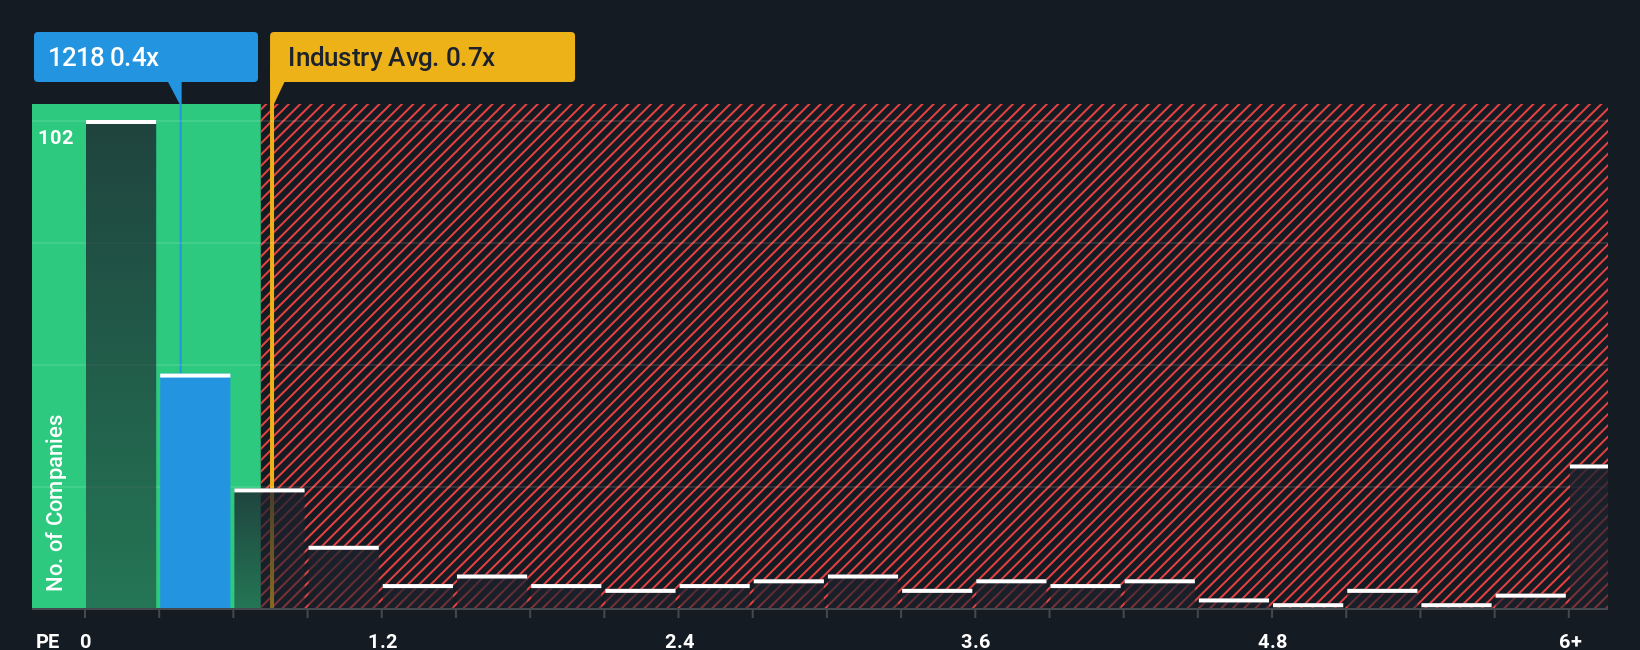
Although its price has surged higher, there still wouldn't be many who think Easyknit International Holdings' price-to-sales (or "P/S") ratio of 0.4x is worth a mention when the median P/S in Hong Kong's Real Estate industry is similar at about 0.7x. While this might not raise any eyebrows, if the P/S ratio is not justified investors could be missing out on a potential opportunity or ignoring looming disappointment.
Trump has pledged to "unleash" American oil and gas and these 15 US stocks have developments that are poised to benefit.
View our latest analysis for Easyknit International Holdings
What Does Easyknit International Holdings' Recent Performance Look Like?
With revenue growth that's exceedingly strong of late, Easyknit International Holdings has been doing very well. The P/S is probably moderate because investors think this strong revenue growth might not be enough to outperform the broader industry in the near future. Those who are bullish on Easyknit International Holdings will be hoping that this isn't the case, so that they can pick up the stock at a lower valuation.
Although there are no analyst estimates available for Easyknit International Holdings, take a look at this free data-rich visualisation to see how the company stacks up on earnings, revenue and cash flow.Do Revenue Forecasts Match The P/S Ratio?
The only time you'd be comfortable seeing a P/S like Easyknit International Holdings' is when the company's growth is tracking the industry closely.
Taking a look back first, we see that the company grew revenue by an impressive 149% last year. The latest three year period has also seen an excellent 51% overall rise in revenue, aided by its short-term performance. Therefore, it's fair to say the revenue growth recently has been superb for the company.
When compared to the industry's one-year growth forecast of 4.6%, the most recent medium-term revenue trajectory is noticeably more alluring
With this information, we find it interesting that Easyknit International Holdings is trading at a fairly similar P/S compared to the industry. It may be that most investors are not convinced the company can maintain its recent growth rates.
The Key Takeaway
Easyknit International Holdings appears to be back in favour with a solid price jump bringing its P/S back in line with other companies in the industry It's argued the price-to-sales ratio is an inferior measure of value within certain industries, but it can be a powerful business sentiment indicator.
To our surprise, Easyknit International Holdings revealed its three-year revenue trends aren't contributing to its P/S as much as we would have predicted, given they look better than current industry expectations. When we see strong revenue with faster-than-industry growth, we can only assume potential risks are what might be placing pressure on the P/S ratio. While recent revenue trends over the past medium-term suggest that the risk of a price decline is low, investors appear to see the likelihood of revenue fluctuations in the future.
We don't want to rain on the parade too much, but we did also find 4 warning signs for Easyknit International Holdings that you need to be mindful of.
It's important to make sure you look for a great company, not just the first idea you come across. So if growing profitability aligns with your idea of a great company, take a peek at this free list of interesting companies with strong recent earnings growth (and a low P/E).
Valuation is complex, but we're here to simplify it.
Discover if Easyknit International Holdings might be undervalued or overvalued with our detailed analysis, featuring fair value estimates, potential risks, dividends, insider trades, and its financial condition.
Access Free AnalysisHave feedback on this article? Concerned about the content? Get in touch with us directly. Alternatively, email editorial-team (at) simplywallst.com.This article by Simply Wall St is general in nature. We provide commentary based on historical data and analyst forecasts only using an unbiased methodology and our articles are not intended to be financial advice. It does not constitute a recommendation to buy or sell any stock, and does not take account of your objectives, or your financial situation. We aim to bring you long-term focused analysis driven by fundamental data. Note that our analysis may not factor in the latest price-sensitive company announcements or qualitative material. Simply Wall St has no position in any stocks mentioned.
Disclaimer: Investing carries risk. This is not financial advice. The above content should not be regarded as an offer, recommendation, or solicitation on acquiring or disposing of any financial products, any associated discussions, comments, or posts by author or other users should not be considered as such either. It is solely for general information purpose only, which does not consider your own investment objectives, financial situations or needs. TTM assumes no responsibility or warranty for the accuracy and completeness of the information, investors should do their own research and may seek professional advice before investing.
Most Discussed
- 1
- 2
- 3
- 4
- 5
- 6
- 7
- 8
- 9
- 10