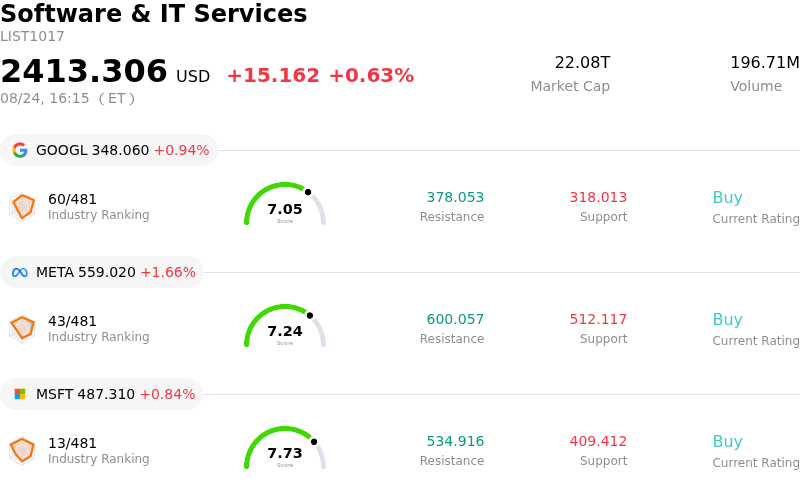
Visa Inc (V) closed up by 3.06%. The Software & IT Services sector is up by 0.63%. The company outperformed the industry. Top 3 stocks by turnover in the sector: Alphabet Inc Class A (GOOGL) up 0.94%; Meta Platforms Inc (META) up 1.66%; Microsoft Corp (MSFT) up 0.84%.
What is driving Visa Inc (V)’s stock price up today?
Visa experienced strong upward momentum and heightened intraday trading activity as investors responded to a confluence of robust fundamental results, institutional portfolio inflows, and positive sector sentiment. The underlying driver of this bullish sentiment stems from the payment processor's recent quarterly financial results, which featured double-digit year-over-year revenue growth and an earnings beat alongside an upgraded full-year outlook. Sustained expansion in overall payment volumes, processed transactions, and cross-border travel spending demonstrated the resilience of global consumer activity and reinforced market confidence in the company's fee-based revenue model.
Institutional portfolio adjustments and recent public disclosures served as another powerful catalyst for the day's price movement. Reports highlighting major hedge funds establishing large positions, alongside disclosures showing significant stock purchases by high-profile investment accounts, sparked heightened buying interest across the market. These institutional endorsements signaled strong conviction in the firm's long-term cash generation capabilities and low-beta defensive growth profile. Furthermore, the company's ongoing capital allocation strategy, supported by substantial share repurchase authorizations and steady dividend payouts, continues to provide a structural tailwind for equity holders.
Positive analyst commentary and technical strength further accelerated the rally. Multiple Wall Street firms recently raised their price objectives and reiterated buy ratings, citing strategic growth initiatives in digital tokenization, agentic payment partnerships, and value-added fraud prevention capabilities. As payment processing stocks seized market leadership, Visa broke through key resistance levels to reach new multi-month peaks, outperforming major broader market indices. Despite ongoing macroeconomic uncertainty and headline monitoring around antitrust regulatory oversight, the combination of institutional buying, analyst optimism, and technical momentum fueled decisive investor demand.
Technical Analysis of Visa Inc (V)
Technically, Visa Inc (V) shows a MACD (12,26,9) value of 1.139, indicating a buy signal. The RSI at 69.580 suggests neutral condition and the Williams %R at 3.943 suggests overbought condition. Please monitor closely.
Media Coverage of Visa Inc (V)
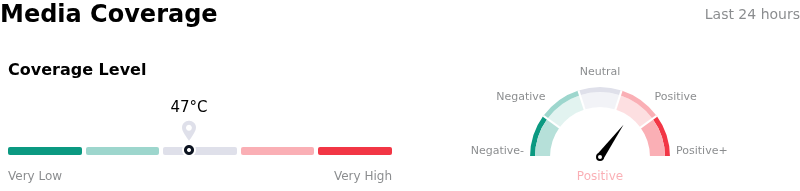
In terms of media coverage, Visa Inc (V) shows a coverage score of 47, indicating a moderate level of media attention. The overall market sentiment index is currently in bullish zone.
Fundamental Analysis of Visa Inc (V)
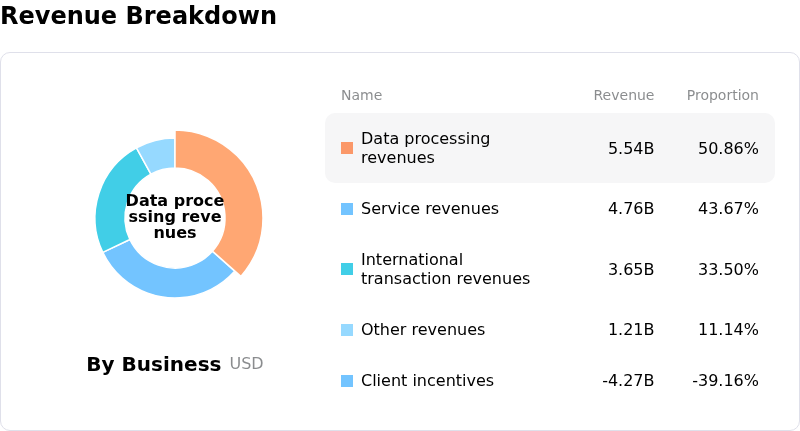
Visa Inc (V) is in the Software & IT Services industry. Its latest annual revenue is $40.00B, ranking 15 in the industry. The net profit is $19.85B, ranking 5 in the industry. Company Profile
Over the past month, multiple analysts have rated the company as Buy, with an average price target of $413.92, a high of $450.00, and a low of $336.60.
More details about Visa Inc (V)
Company Specific Risks:
- DOJ Antitrust Discovery Escalation: Recent court filings reveal intensified legal friction between Visa and the U.S. Department of Justice over discovery schedules and deposition delays in the ongoing debit market monopoly lawsuit, raising legal uncertainty and execution risk ahead of an upcoming federal court hearing.
- Interchange Fee Compression and Settlement Pressures: Implementation of the broad $38 billion merchant antitrust settlement enforces direct cuts and caps on interchange swipe fees, threatening long-term processing yields and gross margins across core payment networks.
- Technical Overextension and Premium Valuation Strain: Following a rapid intraday surge to record highs near $381.90, short-term technical indicators show extreme overbought levels with 1-hour RSI stretching above 79, leaving shares exposed to profit-taking and pullbacks given the stock's elevated ~32x price-to-earnings multiple.
- Notable Executive Share Disposals: SEC Form 144 regulatory filings disclosed significant insider selling by key corporate leaders, including President Ryan McInerney and executive officers, signaling management equity liquidation at record valuation levels.
Find out more