Solana (SOLUSD) is down 1.09% at Sep 1 04:15(ET), now at $101.63, with a 7-day up of 6.22%.
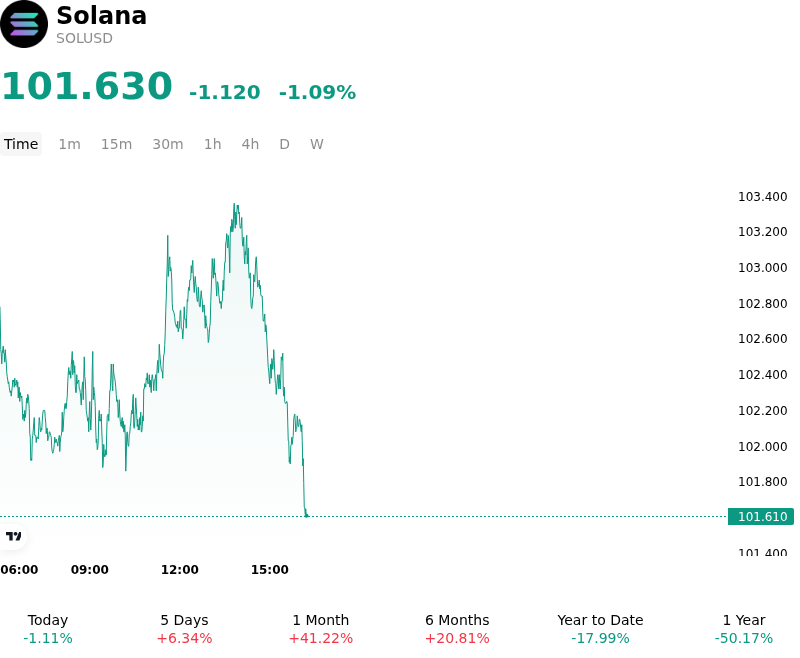
What is driving Solana (SOLUSD)’s stock price down today?
The pullback in Solana reflects short-term profit-taking and tactical de-risking following a significant multi-week rally that pushed the asset back above key technical resistance near the triple-digit threshold. As global markets transition into September, broader risk sentiment across digital assets faced mild headwinds driven by macroeconomic repricing. Investors are re-evaluating Federal Reserve monetary policy expectations amid sticky inflation indicators and persistent geopolitical uncertainties, prompting institutional market participants to lock in gains after a strong calendar month for crypto assets.
From a market structure perspective, the intraday weakness was exacerbated by localized derivative liquidations and leveraged long unwinding. Following the swift push toward multi-month highs, open interest in Solana futures had expanded, leaving the market vulnerable to minor sell-offs. As spot buying pressure temporarily slowed near overhead resistance levels, long positions faced targeted liquidations, squeezing speculative liquidity and contributing to intraday price volatility.
Despite the brief retreat, structural support for Solana remains underpinned by robust ecosystem fundamentals and ongoing institutional adoption. While investors monitor whether spot ETF inflows can maintain their recent momentum, market participants continue to focus on key network developments, including protocol upgrades and expanding enterprise integrations. Consequently, the price action represents a consolidation phase driven by short-term liquidity repricing and seasonal risk management rather than a fundamental shift in institutional sentiment or long-term ecosystem trajectory.
Technical Analysis of Solana (SOLUSD)
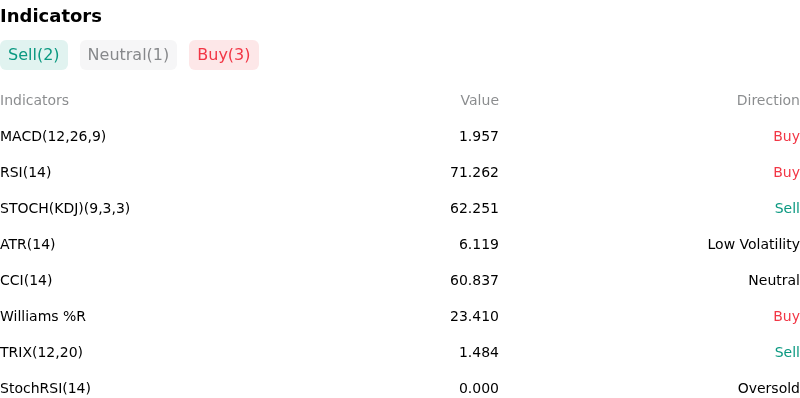
Technically, Solana (SOLUSD) shows a MACD (12,26,9) value of 1.991, indicating a buy signal. The RSI at 71.903 suggests buy condition and the Williams %R at 22.644 suggests buy condition. Please monitor closely.
More details about Solana (SOLUSD)
Recent Events and Risks:
- Leverage Build-up and Cascading Liquidation Hazard: High open interest in Solana futures paired with concentrated leveraged long positions near the psychological $100 support zone creates severe downside risk, as evidenced by over $120 million in recent long liquidations during minor pullbacks.
- Contraction in DEX Volumes and Spot Liquidity: On-chain data reveals a notable slowdown in Solana decentralized exchange (DEX) trading volumes and fading memecoin ecosystem activity, dampening the organic spot buying pressure needed to absorb whale distribution and profit-taking.
- Ecosystem Security Exploits and Smart Contract Risks: A security exploit involving Avici, a Solana-based crypto-banking platform, has reignited concerns regarding application-layer vulnerabilities and custody safety within the broader Solana DeFi network.
- Derivatives Momentum Decay and Technical Overhead Resistance: Momentum indicators such as MACD and ADX reflect persistent selling pressure and hourly trend weakness, raising the risk of a breakdown toward the $94–$96 support levels if buyers fail to clear immediate resistance in the $105–$107 range.
Find out more