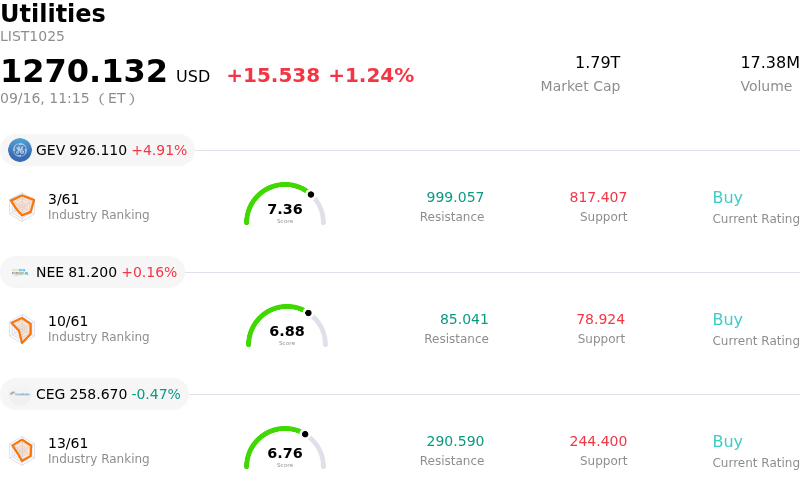
Ge Vernova Inc (GEV) moved up by 4.76%. The Utilities sector is up by 1.24%. The company outperformed the industry. Top 3 stocks by turnover in the sector: Ge Vernova Inc (GEV) up 4.91%; $Nextera Energy Inc(NEE-N)$ (NEE) up 0.18%; Constellation Energy Corp (CEG) down 0.35%.
What is driving Ge Vernova Inc (GEV)’s stock price up today?
GE Vernova experienced a strong upward bounce as market sentiment rebounded following bullish commentary from major Wall Street institutions, counteracting a sharp sell-off earlier in the week. Research analysts at Bernstein reaffirmed their Outperform rating on the stock with a street-high price target, reassuring investors that the growth story extends well beyond immediate artificial intelligence data center demand. The firm highlighted that utility-driven power grid upgrades, energy security, and decarbonization initiatives account for the majority of electrification orders, providing a solid growth foundation regardless of potential AI infrastructure spending fluctuations.
This positive momentum was further bolstered by broader institutional backing and favorable fundamental updates. Fitch Ratings recently upgraded GE Vernova's long-term default rating, citing consistent margin expansion in key operating segments and robust free cash flow generation. Additionally, other major brokerages updated their outlooks on the company's gas services and power segments, emphasizing a multi-year equipment backlog that offers strong revenue visibility. The firm's recent commercial expansions, including wind turbine supply agreements in international markets and joint nuclear ventures, reinforced market confidence in its execution capability.
The upward movement also reflects a technical recovery after aggressive selling drove the stock lower in prior sessions. The earlier decline, triggered by a solitary Wall Street initiation at a Sell rating alongside broader tech infrastructure spending concerns, created an oversold condition. Investors stepped in to purchase the dip, recognizing that GE Vernova remains uniquely positioned to capitalize on global grid constraints, power generation shortages, and long-term electrification trends.
Technical Analysis of Ge Vernova Inc (GEV)
Technically, Ge Vernova Inc (GEV) shows a MACD (12,26,9) value of -1.856, indicating a sell signal. The RSI at 45.714 suggests neutral condition and the Williams %R at 53.506 suggests neutral condition. Please monitor closely.
Media Coverage of Ge Vernova Inc (GEV)
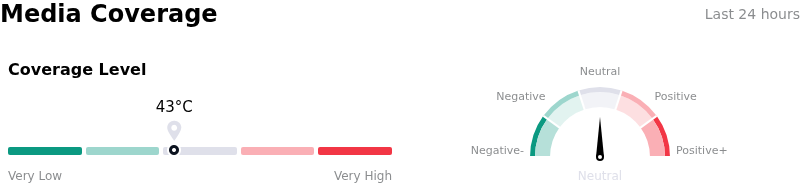
In terms of media coverage, Ge Vernova Inc (GEV) shows a coverage score of 43, indicating a moderate level of media attention. The overall market sentiment index is currently in neutral zone.
Fundamental Analysis of Ge Vernova Inc (GEV)
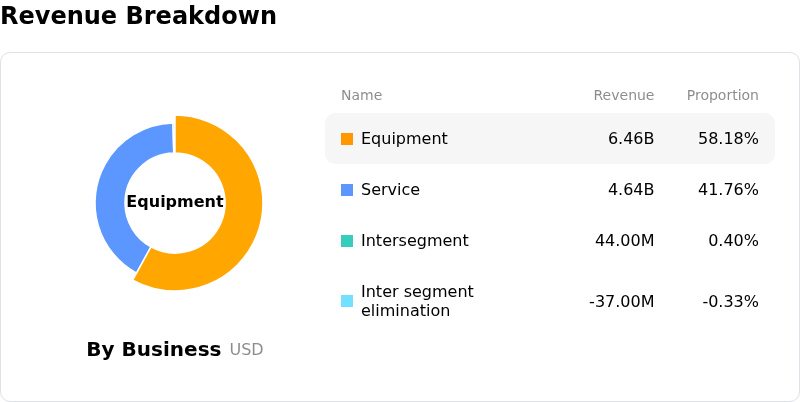
Ge Vernova Inc (GEV) is in the Utilities industry. Its latest annual revenue is $38.07B, ranking 2 in the industry. The net profit is $4.88B, ranking 4 in the industry. Company Profile
Over the past month, multiple analysts have rated the company as Buy, with an average price target of $1216.86, a high of $1450.00, and a low of $836.00.
More details about Ge Vernova Inc (GEV)
Company Specific Risks:
- Street-Low Analyst Downgrade and Valuation Mismatch: GLJ Research initiated coverage on GE Vernova with a "Sell" rating and a Street-low price target of $470, warning that market pricing reflects high-growth AI technology multiples rather than the inherently cyclical nature of its core gas-turbine operations.
- Vulnerability to AI Infrastructure Buildout Slowdown: Heightened market fears of a slowdown or spending friction in hyper-scale AI data center expansion threaten GEV's electrification backlog, exposing the company to potential order cancellations or deferred equipment purchases.
- Persistent Operational Losses in Wind Division: GE Vernova's Wind segment continues to experience execution drag, legacy contract headwinds, and ongoing operating losses, which threaten to consume cash flow and offset margin expansion across the Power and Electrification divisions.
- Extended Revenue Timelines and Project Execution Bottlenecks: Multi-year order-to-delivery timelines of 4 to 5 years for heavy turbines, combined with grid interconnection delays and supply chain friction, leave near-term earnings vulnerable to conversion delays and cost overruns.
Find out more