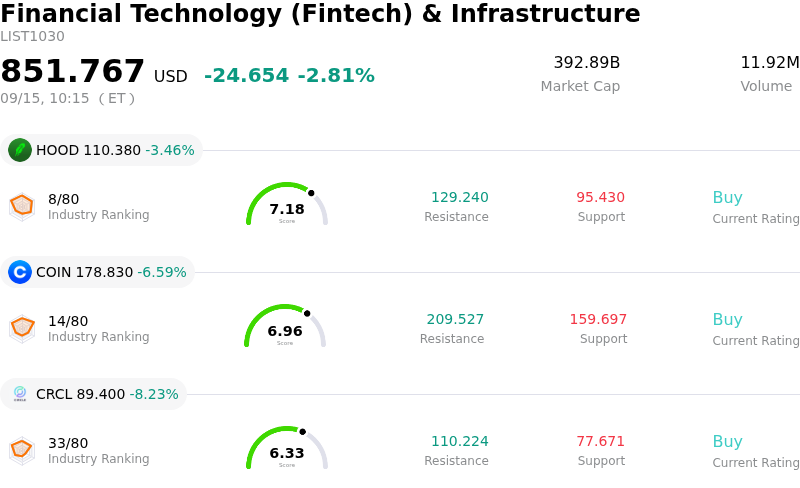
Circle Internet Group Inc (CRCL) moved down by 8.07%. The Financial Technology (Fintech) & Infrastructure sector is down by 2.81%. The company underperformed the industry. Top 3 stocks by turnover in the sector: Robinhood Markets Inc (HOOD) down 3.47%; Coinbase Global Inc (COIN) down 6.59%; Circle Internet Group Inc (CRCL) down 8.23%.
What is driving Circle Internet Group Inc (CRCL)’s stock price down today?
Circle Internet Group experienced a notable pullback as market participants capitalized on recent gains following an extended rally. The stock had previously benefited from momentum tied to broader cryptocurrency strength, regulatory developments around stablecoin oversight, and positive sentiment following the release of legislative drafts like the Clarity Act. However, after testing upper technical resistance levels, short-term profit-taking set in, driven by growing caution surrounding the company's elevated valuation relative to near-term earnings metrics.
Investors are increasingly scrutinizing the underlying unit economics of the business, particularly as distribution, transaction, and partner payment costs have expanded significantly year-over-year. While total stablecoin circulation remains robust, Circle's heavy reliance on reserve income tied to Treasury yields exposes revenue to macroeconomic interest rate shifts. Rising operational expenditures and partner payouts have pressured operating margins, prompting institutional investors to question whether prevailing valuation multiples adequately reflect near-term cash flow realities.
Market sentiment is also digesting recent corporate developments, including the all-stock transaction to acquire cross-border payments platform Tazapay. Although the acquisition is designed to accelerate global B2B settlement integration and expand transaction volume, the stock-funded structure introduces potential share dilution and heightened integration risk. Combined with the asset's high beta relative to digital asset sentiment, these structural and strategic factors contributed to pronounced intraday volatility as institutional portfolios rebalanced exposure.
Technical Analysis of Circle Internet Group Inc (CRCL)
Technically, Circle Internet Group Inc (CRCL) shows a MACD (12,26,9) value of -1.679, indicating a neutral signal. The RSI at 52.368 suggests neutral condition and the Williams %R at 80.011 suggests oversold condition. Please monitor closely.
Fundamental Analysis of Circle Internet Group Inc (CRCL)
Circle Internet Group Inc (CRCL) is in the Financial Technology (Fintech) & Infrastructure industry. Its latest annual revenue is $2.75B, ranking 12 in the industry. The net profit is $-69.51M, ranking 84 in the industry. Company Profile
Over the past month, multiple analysts have rated the company as Buy, with an average price target of $103.69, a high of $243.00, and a low of $37.00.
More details about Circle Internet Group Inc (CRCL)
Company Specific Risks:
- Legislative Disagreements and Yield Restriction Risks: Intraday volatility and price declines stem from eroding passage odds for the Digital Asset Market Clarity Act ahead of a Senate cloture vote, as unresolved disputes over stablecoin yield restrictions threaten Circle's core monetization model.
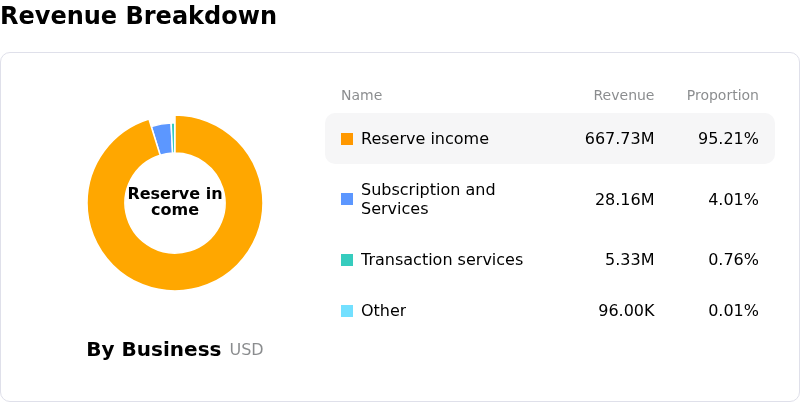
- Extreme Revenue Concentration in Reserve Yields: Approximately 85% to 95% of total revenue relies directly on interest income generated from USDC reserve assets, leaving company earnings highly vulnerable to Federal Reserve rate decisions and potential rate cuts.
- Dilution and Execution Risk from All-Stock Acquisition: Following recent SEC 8-K disclosures regarding a $400 million all-stock agreement to acquire Singapore-based Tazapay, shareholders face immediate equity dilution alongside multi-jurisdictional regulatory and integration risks.
- Premium Valuation and Heavy Insider Selling: Trading at an elevated valuation exceeding 54x P/E with capped analyst price targets, the stock faces persistent overhead pressure compounded by over $310 million in cumulative insider stock sales under Rule 10b5-1 trading plans.
Find out more