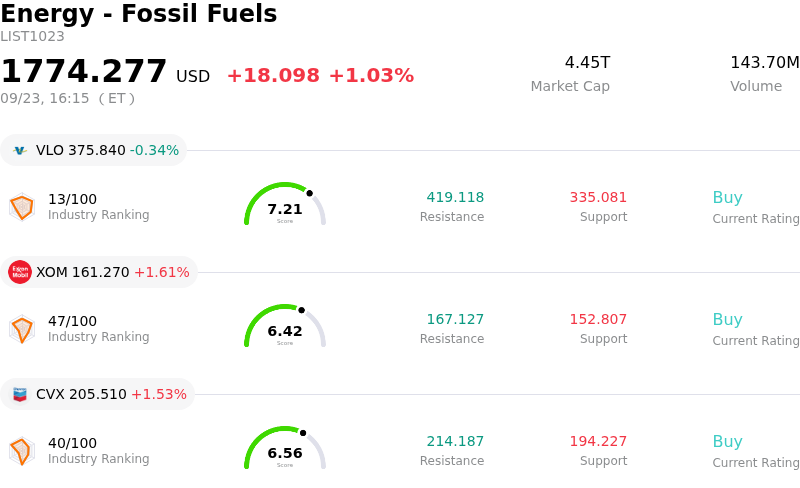
BP PLC (BP) closed up by 3.23%. The Energy - Fossil Fuels sector is up by 1.03%. The company outperformed the industry. Top 3 stocks by turnover in the sector: Valero Energy Corp (VLO) down 0.34%; Exxon Mobil Corp (XOM) up 1.61%; Chevron Corp (CVX) up 1.53%.
What is driving BP PLC (BP)’s stock price up today?
BP experienced strong upward momentum during the trading session following a high-profile upgrade from J.P. Morgan, which raised its rating on the integrated energy giant from Neutral to Overweight while substantially lifting its price target. Wall Street analysts noted that after lagging its global major peers over recent years, BP is entering a pivotal phase of operational and fundamental recovery. Central to the renewed institutional optimism is the company's aggressive balance sheet repair and deleveraging strategy, which is projected to significantly lower total financial obligations and bring gearing metrics back in line with European industry peers over the coming years.
Beyond balance sheet improvements, institutional sentiment was reinforced by BP's ongoing internal restructuring agenda and disciplined capital allocation. Analysts emphasized that BP's strategy to streamline its upstream pipeline while maintaining low direct exposure to Middle Eastern operational assets provides a favorable risk-reward balance amidst geopolitical uncertainty. Strong free cash flow yield prospects, paired with competitive refining operations and flexible trading capabilities, are expected to reduce the company's cyclical sensitivity to commodity price swings and support long-term shareholder distribution growth.
The advance was further reinforced by broader institutional interest in cash-generative energy equities trading at attractive valuation discounts relative to historical averages. Continued positive coverage across Wall Street highlighting robust second-half cash flow projections and strategic asset sales helped solidify investor confidence in management's execution. Combined, these fundamental catalysts and favorable institutional repositioning provided strong tailwinds for the stock's positive performance.
Technical Analysis of BP PLC (BP)
Technically, BP PLC (BP) shows a MACD (12,26,9) value of -0.516, indicating a neutral signal. The RSI at 52.026 suggests neutral condition and the Williams %R at 55.750 suggests sell condition. Please monitor closely.
Fundamental Analysis of BP PLC (BP)
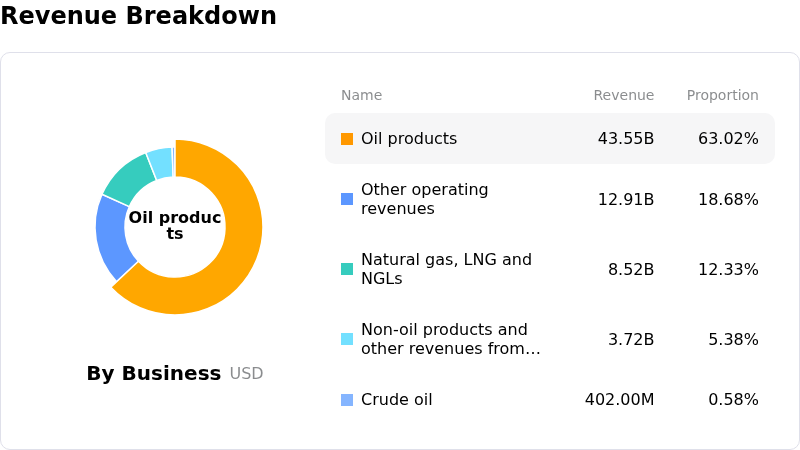
BP PLC (BP) is in the Energy - Fossil Fuels industry. Its latest annual revenue is $189.34B, ranking 3 in the industry. The net profit is $54.00M, ranking 63 in the industry. Company Profile
Over the past month, multiple analysts have rated the company as Buy, with an average price target of $49.09, a high of $64.00, and a low of $41.00.
More details about BP PLC (BP)
Company Specific Risks:
- Balance Sheet Leverage and Capital Constraints: Institutional analyst assessments highlight that BP's historical strategic inconsistencies and elevated net debt levels relative to European peers continue to constrain cash flow allocation, forcing reliance on asset sales to achieve deleveraging goals.
- Forced Upstream Asset Divestments: BP's agreement to sell a 5% stake in Western Australia's Browse LNG project to Osaka Gas underscores ongoing balance sheet pressure, forcing management to farm out future upside in key natural gas projects to raise capital.
- Operational Execution and Reliability Vulnerabilities: Intraday trading volatility has been exacerbated by operational lapses, highlighted by BP-operated upstream plant reliability slipping to 92.4% alongside an uptick in Tier 1 and Tier 2 process safety events.
- Elevated Commodity and Refining Sensitivity: Brokerage research notes that BP possesses the highest refining and crude oil price sensitivity among European integrated majors—approximately 180 basis points of earnings impact for every $10 per barrel shift—leaving intraday revenue expectations exposed to sharp pullbacks in crude futures.
Find out more