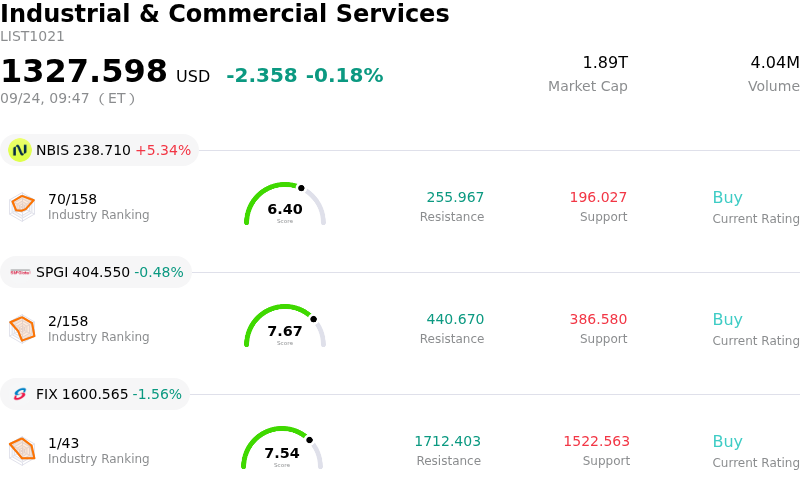
Nebius Group NV (NBIS) opened up by 5.79%. The Industrial & Commercial Services sector is down by 0.18%. The company outperformed the industry. Top 3 stocks by turnover in the sector: Nebius Group NV (NBIS) up 5.79%; S&P Global Inc (SPGI) down 0.48%; Comfort Systems USA Inc (FIX) down 1.56%.
What is driving Nebius Group NV (NBIS)’s stock price up today?
Nebius Group experienced a notable upward trajectory driven by renewed investor enthusiasm around the company's pricing strategy and accelerating demand for artificial intelligence infrastructure. Sentiment was boosted following reports that the company is implementing higher pricing across its on-demand graphics processing unit computing resources, demonstrating firm pricing power amidst ongoing global compute constraints. As a specialized full-stack AI cloud provider, Nebius is positioned to benefit directly from expanding compute demand, reinforcing expectations for enhanced profitability and faster backlog conversion.
Fundamental momentum continues to be anchored by robust commercial progress and significant enterprise commitments. The market remains focused on the company's expanding contract backlog, which includes multi-billion-dollar long-term agreements with major technology enterprises and strategic backing from industry-leading chip manufacturers. Recent management guidance reaffirming accelerated power capacity expansion across data center facilities has helped soothe prior market anxieties regarding potential execution delays and heavy capital expenditure commitments.
Market dynamics and short-side positioning also contributed to the intraday momentum. With short interest remaining at elevated levels across the AI infrastructure group, positive operational news flow prompted short-covering activity, adding upward pressure to the share price. Broader sector tailwinds in artificial intelligence and semiconductor equities further supported buying volume, as institutional investors repositioned into high-growth infrastructure plays displaying strong revenue visibility.
Technical Analysis of Nebius Group NV (NBIS)
Technically, Nebius Group NV (NBIS) shows a MACD (12,26,9) value of 3.233, indicating a buy signal. The RSI at 56.775 suggests neutral condition and the Williams %R at 31.413 suggests buy condition. Please monitor closely.
Fundamental Analysis of Nebius Group NV (NBIS)
Nebius Group NV (NBIS) is in the Industrial & Commercial Services industry. Its latest annual revenue is $529.80M, ranking 113 in the industry. The net profit is $82.50M, ranking 74 in the industry. Company Profile
Over the past month, multiple analysts have rated the company as Buy, with an average price target of $287.48, a high of $410.00, and a low of $144.00.
More details about Nebius Group NV (NBIS)
Company Specific Risks:
- Analyst Coverage Downgrade: Rothschild & Co Redburn initiated coverage on Nebius Group with a Sell rating and an $84 price target—representing substantial downside from current trading levels above $220—citing unsustainable equity valuation metrics and long-term monetization headwinds.
- Escalating Capital Expenditure and Hardware Costs: Rising market prices for high-end GPUs, memory, and server infrastructure are driving extreme capital expenditure requirements, increasing balance sheet leverage and threatening profitability despite top-line revenue expansion.
- Stretched Valuation and Hyperscaler Threat: Trading at a Price-to-Sales ratio above 45x, the stock exhibits severe volatility risk if key hyperscalers replicate its boutique AI cloud infrastructure model or if enterprise demand decelerates.
- Insider Selling and Dilution Exposure: SEC Form 4 filings detail continued open-market share sales by corporate directors and executive officers, compounding investor concern over equity dilution needed to fund ongoing capital commitments.
Find out more