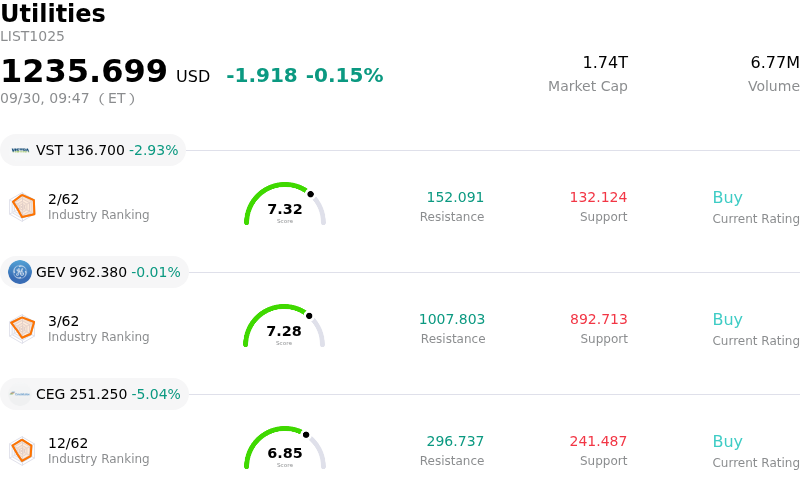
Constellation Energy Corp (CEG) opened down by 5.04%. The Utilities sector is down by 0.15%. The company underperformed the industry. Top 3 stocks by turnover in the sector: Vistra Corp (VST) down 2.93%; Ge Vernova Inc (GEV) down 0.01%; Constellation Energy Corp (CEG) down 5.04%.
What is driving Constellation Energy Corp (CEG)’s stock price down today?
Constellation Energy experienced notable downside volatility as investors continue to reassess valuation multiples across clean power producers tied to artificial intelligence data center demand. Following an extensive multi-year expansion, the market has grown increasingly sensitive to the timeline required to convert large-scale nuclear power purchase agreements into realized top-line cash flows. Despite strong underlying operational demand from hyperscalers seeking firm, emissions-free electricity, profit-taking and sector-wide position adjustments have placed persistent pressure on premium-valued utility names.
A key operational headwind weighing on sentiment involves execution and grid connectivity timelines for signature projects, most notably the planned restart of the Crane Clean Energy Center backed by a twenty-year agreement with Microsoft. Uncertainties regarding regional transmission operator queue timelines and grid interconnection approvals have sparked concerns that full commercial synchronization could face delays beyond early target dates. Although regulatory milestones such as Nuclear Regulatory Commission environmental reviews continue to advance, prospective timeline shifts dilute the net present value of long-term contracts and elevate headline risk for investors evaluating hyperscaler growth catalysts.
In addition to grid-related headwinds, Constellation continues to navigate balance sheet realities following its major acquisition of Calpine. The integration has driven up debt service costs and created a noticeable divergence between reported GAAP net income and adjusted operating earnings. Higher interest expenses, coupled with asset divestitures executed to satisfy regulatory conditions and deleverage, have constrained near-term financial flexibility. While management has raised full-year operating earnings guidance and maintained solid capacity factors across its nuclear fleet, share performance remains governed by how quickly the market gains clarity on grid queue resolutions, balance sheet deleveraging, and execution timelines for data center energy deliveries.
Technical Analysis of Constellation Energy Corp (CEG)
Technically, Constellation Energy Corp (CEG) shows a MACD (12,26,9) value of -3.223, indicating a sell signal. The RSI at 36.914 suggests neutral condition and the Williams %R at 91.565 suggests oversold condition. Please monitor closely.
Media Coverage of Constellation Energy Corp (CEG)
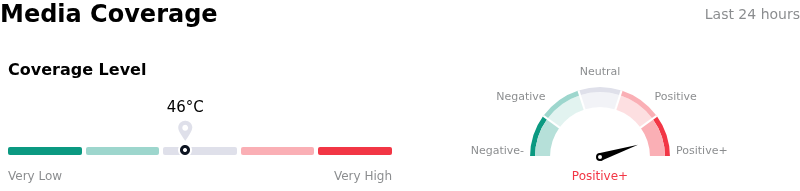
In terms of media coverage, Constellation Energy Corp (CEG) shows a coverage score of 46, indicating a moderate level of media attention. The overall market sentiment index is currently in extremely bullish zone.
Fundamental Analysis of Constellation Energy Corp (CEG)
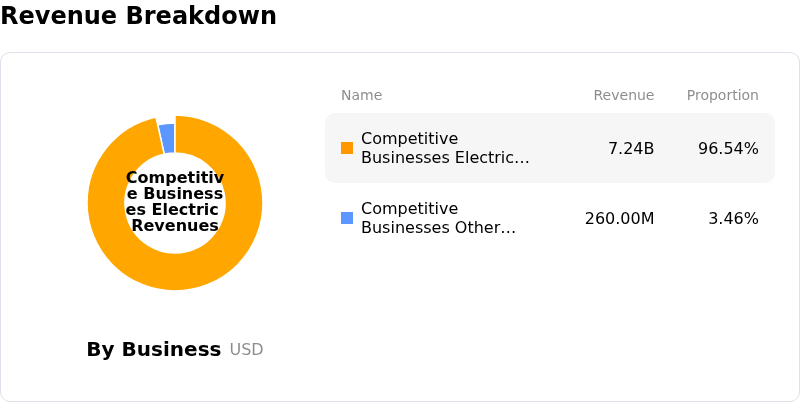
Constellation Energy Corp (CEG) is in the Utilities industry. Its latest annual revenue is $25.53B, ranking 7 in the industry. The net profit is $2.32B, ranking 11 in the industry. Company Profile
Over the past month, multiple analysts have rated the company as Buy, with an average price target of $346.16, a high of $441.00, and a low of $290.00.
More details about Constellation Energy Corp (CEG)
Company Specific Risks:
- Grid Interconnection Delays for Crane Clean Energy Center: Regional grid operator PJM Interconnection signaled potential transmission queue delays extending as far as 2031 for the Crane facility (formerly Three Mile Island), directly threatening Constellation's targeted 2027 restart timeline and risking the deferral of cash flows under its 20-year Power Purchase Agreement with Microsoft.
- Calpine Equity Consideration Overhang and Supply Pressure: Ongoing distribution and secondary sales of shares issued as transaction consideration for the $16.4 billion Calpine acquisition continue to create a persistent supply-demand imbalance and technical selling overhang in the market.
- Surging Debt Load and High Net Interest Expense Drag: Total long-term debt expanded to $19.11 billion to fund major acquisitions, driving quarterly net interest expenses up 140% to $283 million and causing GAAP net income to diverge sharply below non-GAAP adjusted earnings.
- Earnings Guidance Reliance on Volatile Enhanced Pricing: Management's full-year operating earnings targets heavily depend on volatile, unhedged enhanced earnings and wholesale power price realization rather than volume growth, exposing profitability to commodity price swings and broader utility sector yield headwinds.
Find out more