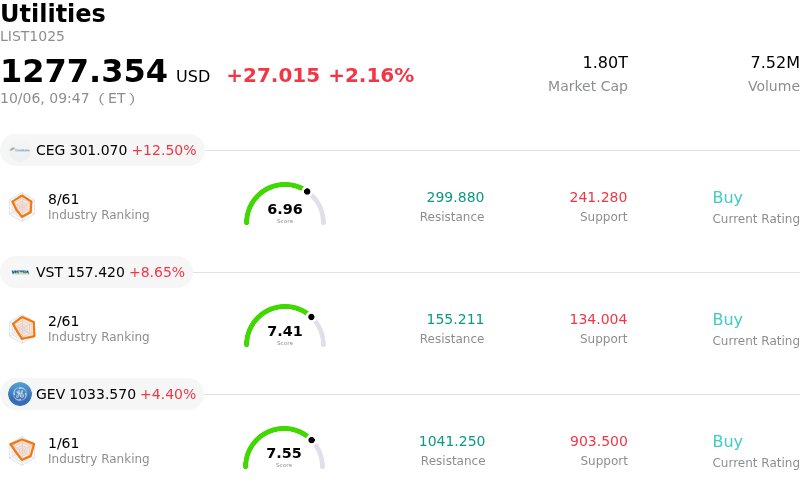
Ge Vernova Inc (GEV) opened up by 4.40%. The Utilities sector is up by 2.16%. The company outperformed the industry. Top 3 stocks by turnover in the sector: Constellation Energy Corp (CEG) up 12.29%; Vistra Corp (VST) up 8.72%; Ge Vernova Inc (GEV) up 4.40%.
What is driving Ge Vernova Inc (GEV)’s stock price up today?
GE Vernova experienced notable upward momentum alongside elevated intraday volatility, primarily driven by sustained institutional demand following positive sell-side research updates and accelerating tailwinds across its core energy infrastructure segments. Wall Street analysts have recently reiterated bullish ratings and raised multi-year earnings projections, pointing to robust order momentum across gas turbine equipment, power grid hardware, and high-margin service contracts.
Investor sentiment continues to be propelled by secular growth trends tied to artificial intelligence data center expansion and global grid modernization. Power utilities and technology hyperscalers are aggressively securing generation hardware and reserving production slots, providing the company with strong revenue visibility extending through the end of the decade. Recent market interest has been further reinforced by operational milestones, including securing a construction permit for its small modular nuclear reactor project, which highlights the firm's strategic positioning within the broader baseload clean energy transition.
Fundamentally, management's upgraded free cash flow outlook and substantial order backlog offer institutional investors confidence in cash generation and margin expansion. While the market continues to monitor supply chain capacity constraints in grid equipment and gas turbines, the prevailing narrative remains anchored on the rapid conversion of customer down payments into scalable revenue across the high-margin Power and Electrification divisions.
Technical Analysis of Ge Vernova Inc (GEV)
Technically, Ge Vernova Inc (GEV) shows a MACD (12,26,9) value of 21.614, indicating a buy signal. The RSI at 65.630 suggests neutral condition and the Williams %R at 2.245 suggests overbought condition. Please monitor closely.
Fundamental Analysis of Ge Vernova Inc (GEV)
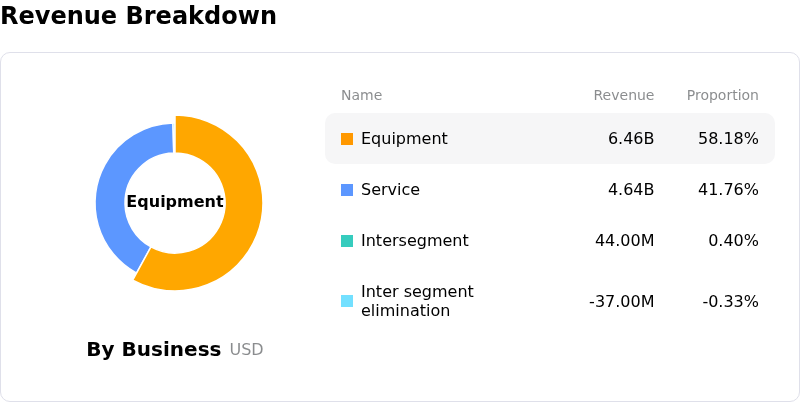
Ge Vernova Inc (GEV) is in the Utilities industry. Its latest annual revenue is $38.07B, ranking 2 in the industry. The net profit is $4.88B, ranking 4 in the industry. Company Profile
Over the past month, multiple analysts have rated the company as Buy, with an average price target of $1182.18, a high of $1450.00, and a low of $470.00.
More details about Ge Vernova Inc (GEV)
Company Specific Risks:
- Persistent Wind Segment EBITDA Losses: The Wind division remains a key operational bottleneck, suffering from continued EBITDA losses and revenue declines that drag down blended profit margins despite strong momentum in Power and Electrification.
- Cyclical Peak and Order Intake Risk: Institutional analysts have raised concerns that the multi-year surge in gas-turbine and power-generation equipment orders may be reaching a cyclical peak, leaving GEV’s premium valuation multiple vulnerable to sector downgrades and profit-taking.
- Second-Half Cash Flow Deceleration: Following a heavily front-loaded first half driven by initial customer down payments, executive commentary warned of a sharp deceleration in second-half cash generation, creating execution risk around late-year financial targets.
- Data Center Grid Pushback and Tariff Uncertainties: Pipeline conversion faces friction from increasing state-level regulatory pushback on energy-intensive AI data center projects, alongside U.S. tariff and macroeconomic uncertainties delaying wind project order conversions.
Find out more