Solana (SOLUSD) is down 1.09% at Oct 11 00:00(ET), now at $108.16, with a 7-day down of 10.08%.
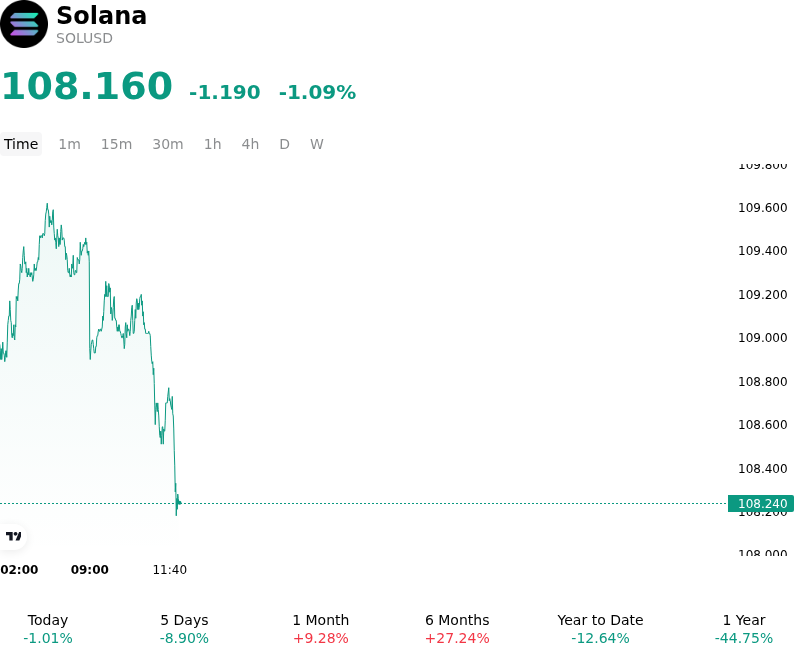
What is driving Solana (SOLUSD)’s stock price down today?
The downward price pressure on Solana reflects a combination of localized exchange inflows and persistent macroeconomic headwinds weighing on high-beta digital assets. A notable increase in on-chain transfers from large holders and entity unstaking events—redirecting significant capital onto major centralized exchanges—has expanded the immediate liquid float. This influx generated overhead spot selling pressure as traders anticipated potential liquidations, dampening short-term buying appetite. Simultaneously, firm U.S. Treasury yields and sustained strength in the U.S. dollar continue to tighten broader macro liquidity conditions, encouraging institutional market participants to scale back exposure to speculative altcoins.
From a protocol perspective, the move highlights a sell-the-news reaction following the mainnet deployment of Solana's performance upgrade, which reduced slot times to 200 milliseconds. While the technical accomplishment underscores the network's high-throughput capability and layer-one scaling roadmap, market participants largely viewed the milestone as already reflected in valuations. Because faster block production times improve execution speed without immediately translating into expanded network fees or direct token economic yields for native holders, fundamental performance metrics failed to provide an immediate floor against broader market de-risking.
Derivatives positioning and institutional capital flows further compounded the downward momentum. Net outflows from spot digital asset vehicles have eroded institutional bid depth at key support thresholds, weakening structural buying demand. In derivative markets, long liquidation cascades in perpetual futures triggered additional forced selling after key support levels gave way, clearing out overleveraged bullish positioning. Although long-term ecosystem prospects remain anchored by enterprise settlement frameworks and real-world adoption initiatives, short-term price action remains constrained by exchange liquidity imbalances, derivative deleveraging, and cautious risk appetite.
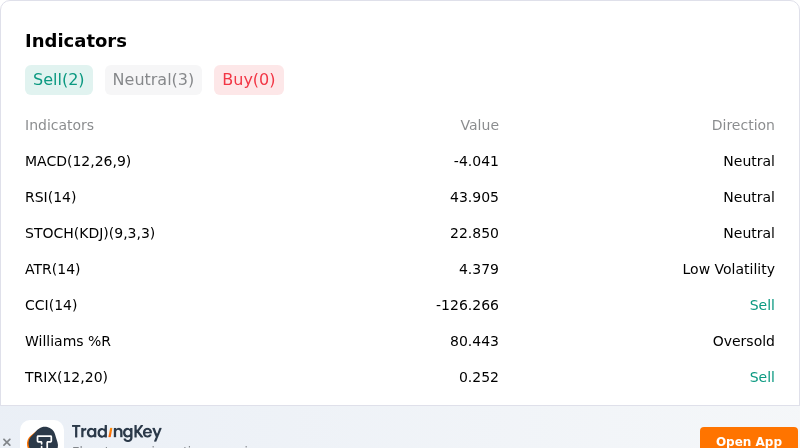
Technical Analysis of Solana (SOLUSD)
Technically, Solana (SOLUSD) shows a MACD (12,26,9) value of -4.041, indicating a neutral signal. The RSI at 43.905 suggests neutral condition and the Williams %R at 80.443 suggests oversold condition. Please monitor closely.
More details about Solana (SOLUSD)
Recent Events and Risks:
- Spot ETF Outflows and Institutional Demand Softening: Solana-focused spot products recorded consecutive daily net outflows, reversing previous steady inflow trends and signaling a reduction in institutional buy-side support that leaves price action vulnerable to market dips.
- Derivatives Leverage Unwinds and Support Breakdown: A drop below key short-term support levels around $116–$117 triggered millions of dollars in forced long liquidations on crypto exchanges, exacerbating intraday downward momentum and amplifying downside volatility.
- High-Beta Exposure to Macro Risk-Off Moves: Amid broader market de-risking and hawkish macroeconomic signals ahead of central bank updates, Solana's high-beta profile relative to Bitcoin and Ethereum has led to steeper percentage losses during market-wide pullbacks.
- Fundamental Decoupling and Large Trader Liquidation Vulnerabilities: Despite elevated daily active address metrics, large localized margin unwinds by high-leverage traders highlight how speculative derivative liquidations continue to exert short-term price suppression despite robust on-chain network activity.
Find out more